

Surge Pricing: Uber Shares Take Off
Plus: The Signal & The Noise

“The best time to plant a tree was 20 years ago. The second-best time is now.”
-Chinese proverb
“If you think nobody cares if you’re alive, try missing a couple of car payments.”
-Earl Wilson
Hey Readers!
Short note this week as I’ve been a bit under the weather and also limping around from a bad knee injury.
Yep, last week I joked about learning how to ski and ‘if there was no note next week you can guess how that went’. I’m hilarious.🫠
Anyway, please provide knee brace recommendations in the comments.
Have a good weekend,
- Ryan


Street Stories
Surge Pricing: Uber Shares Take Off
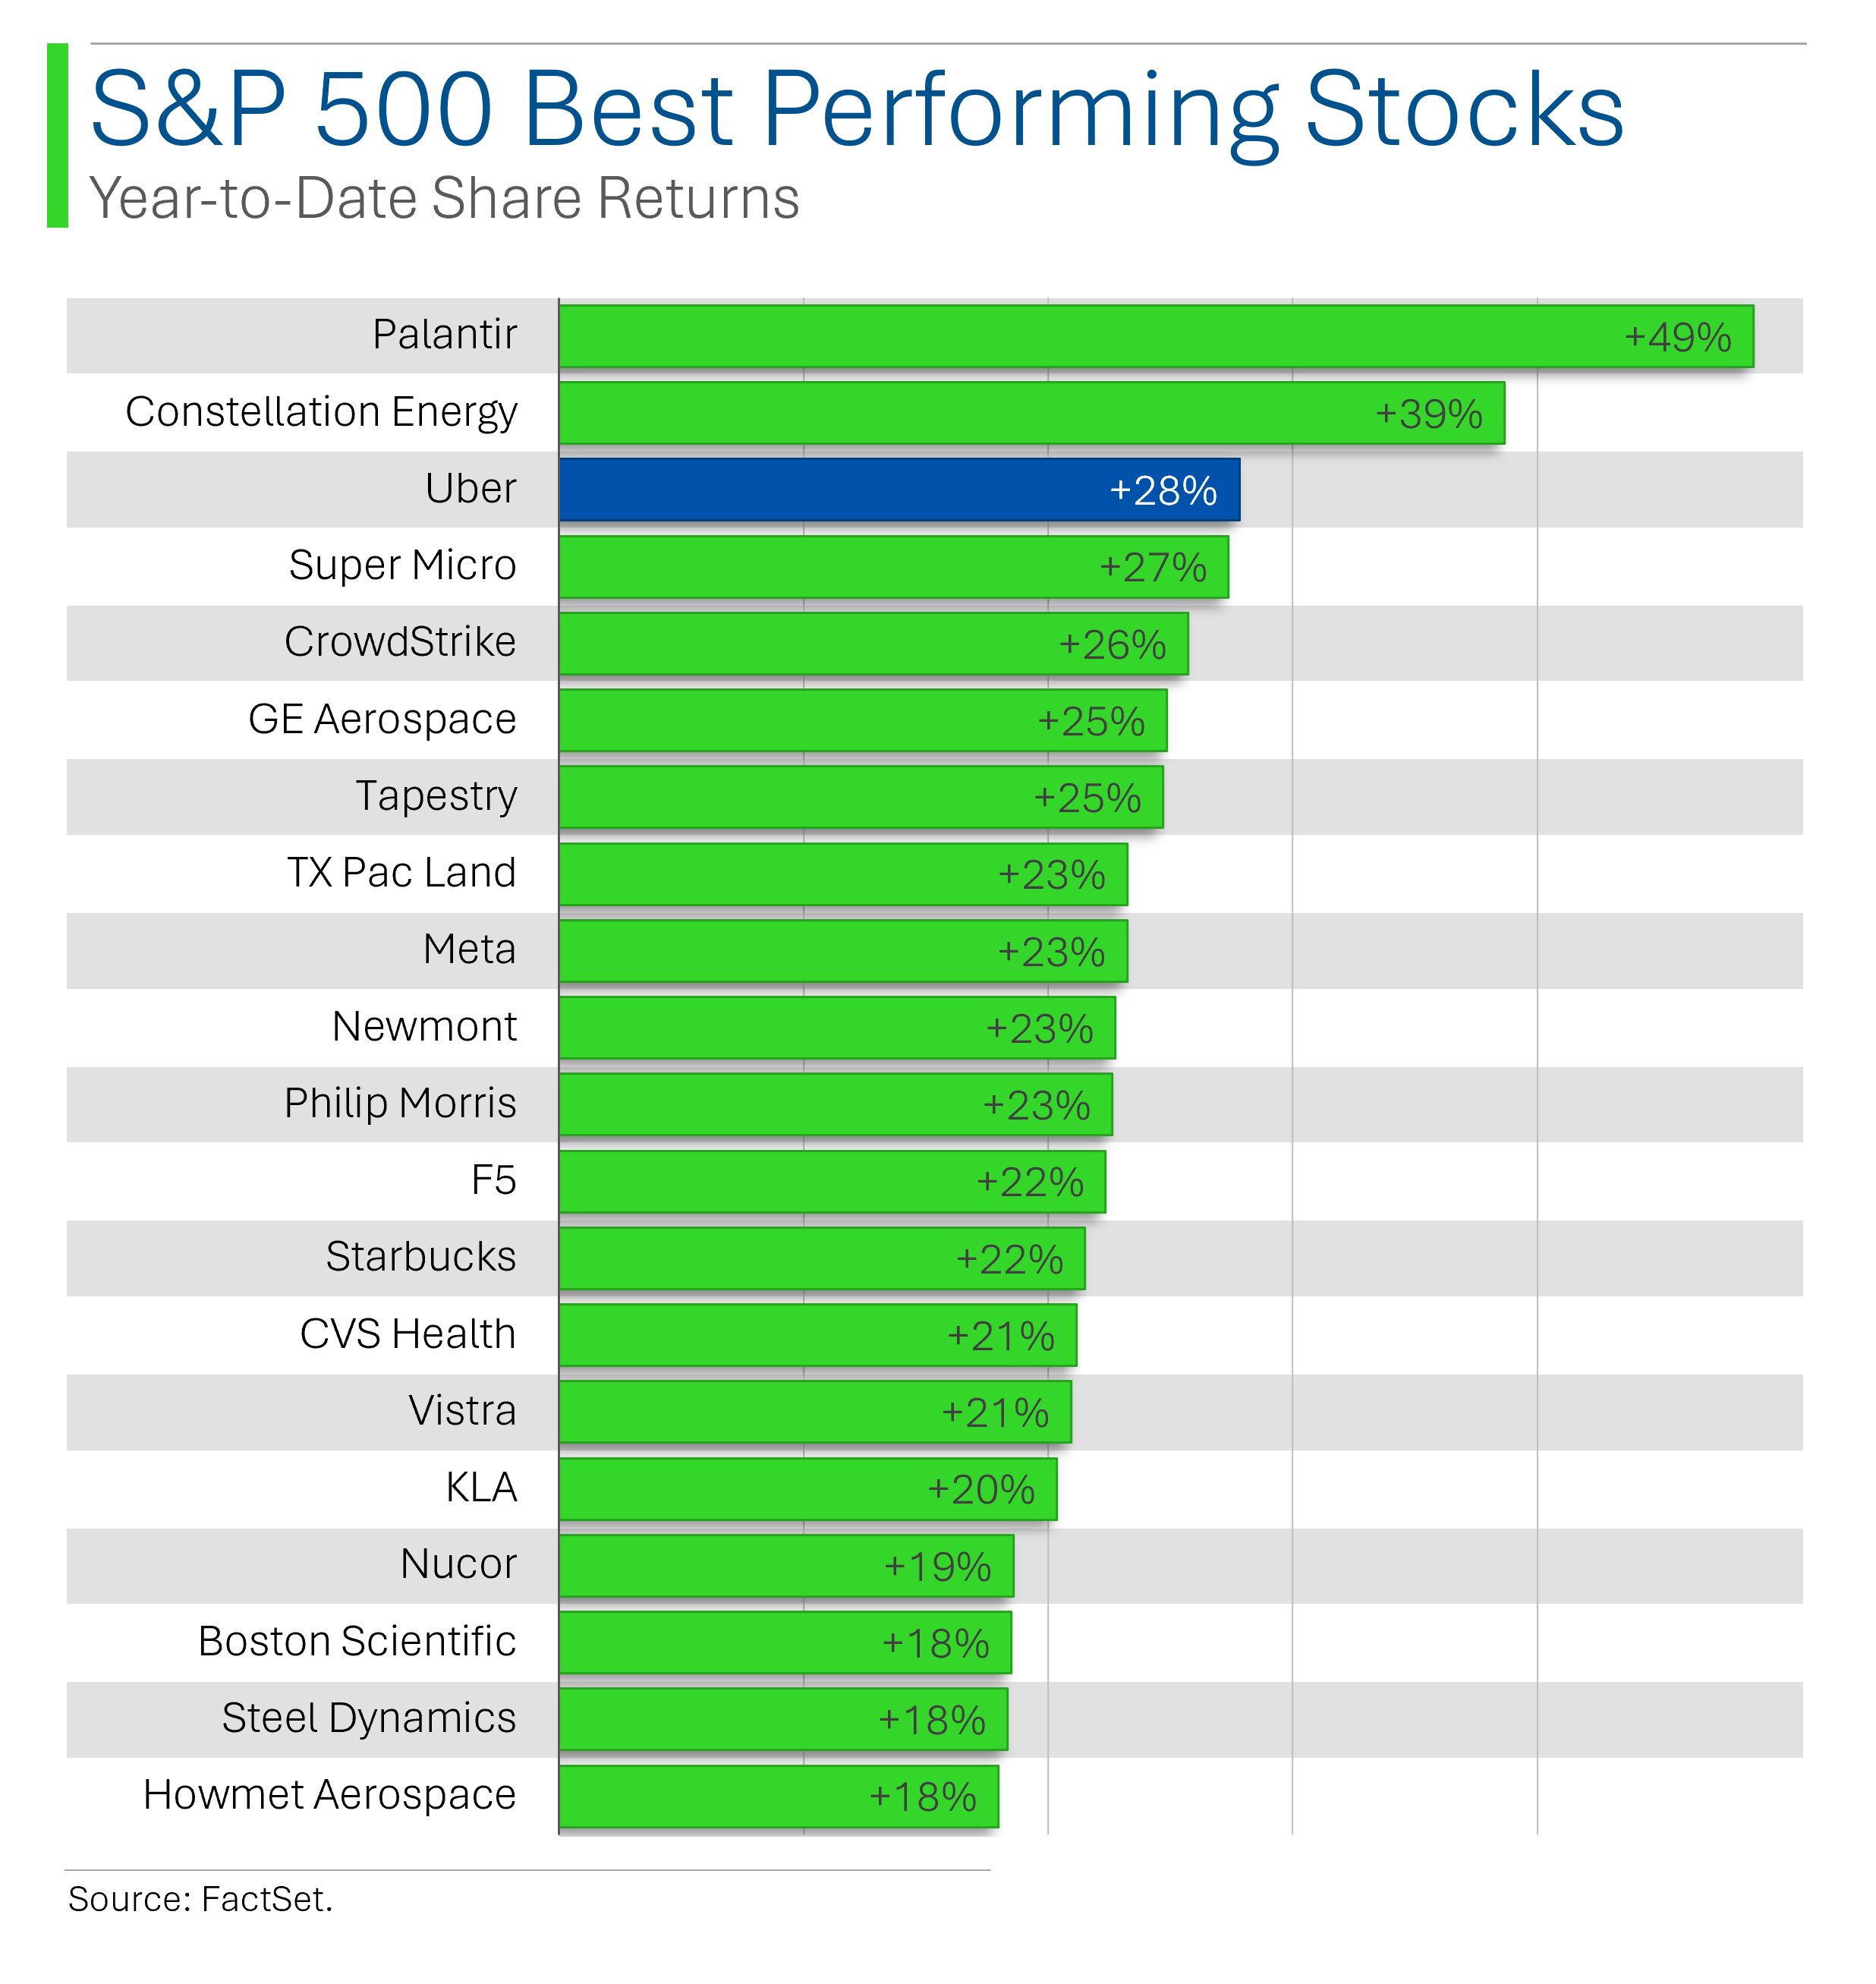
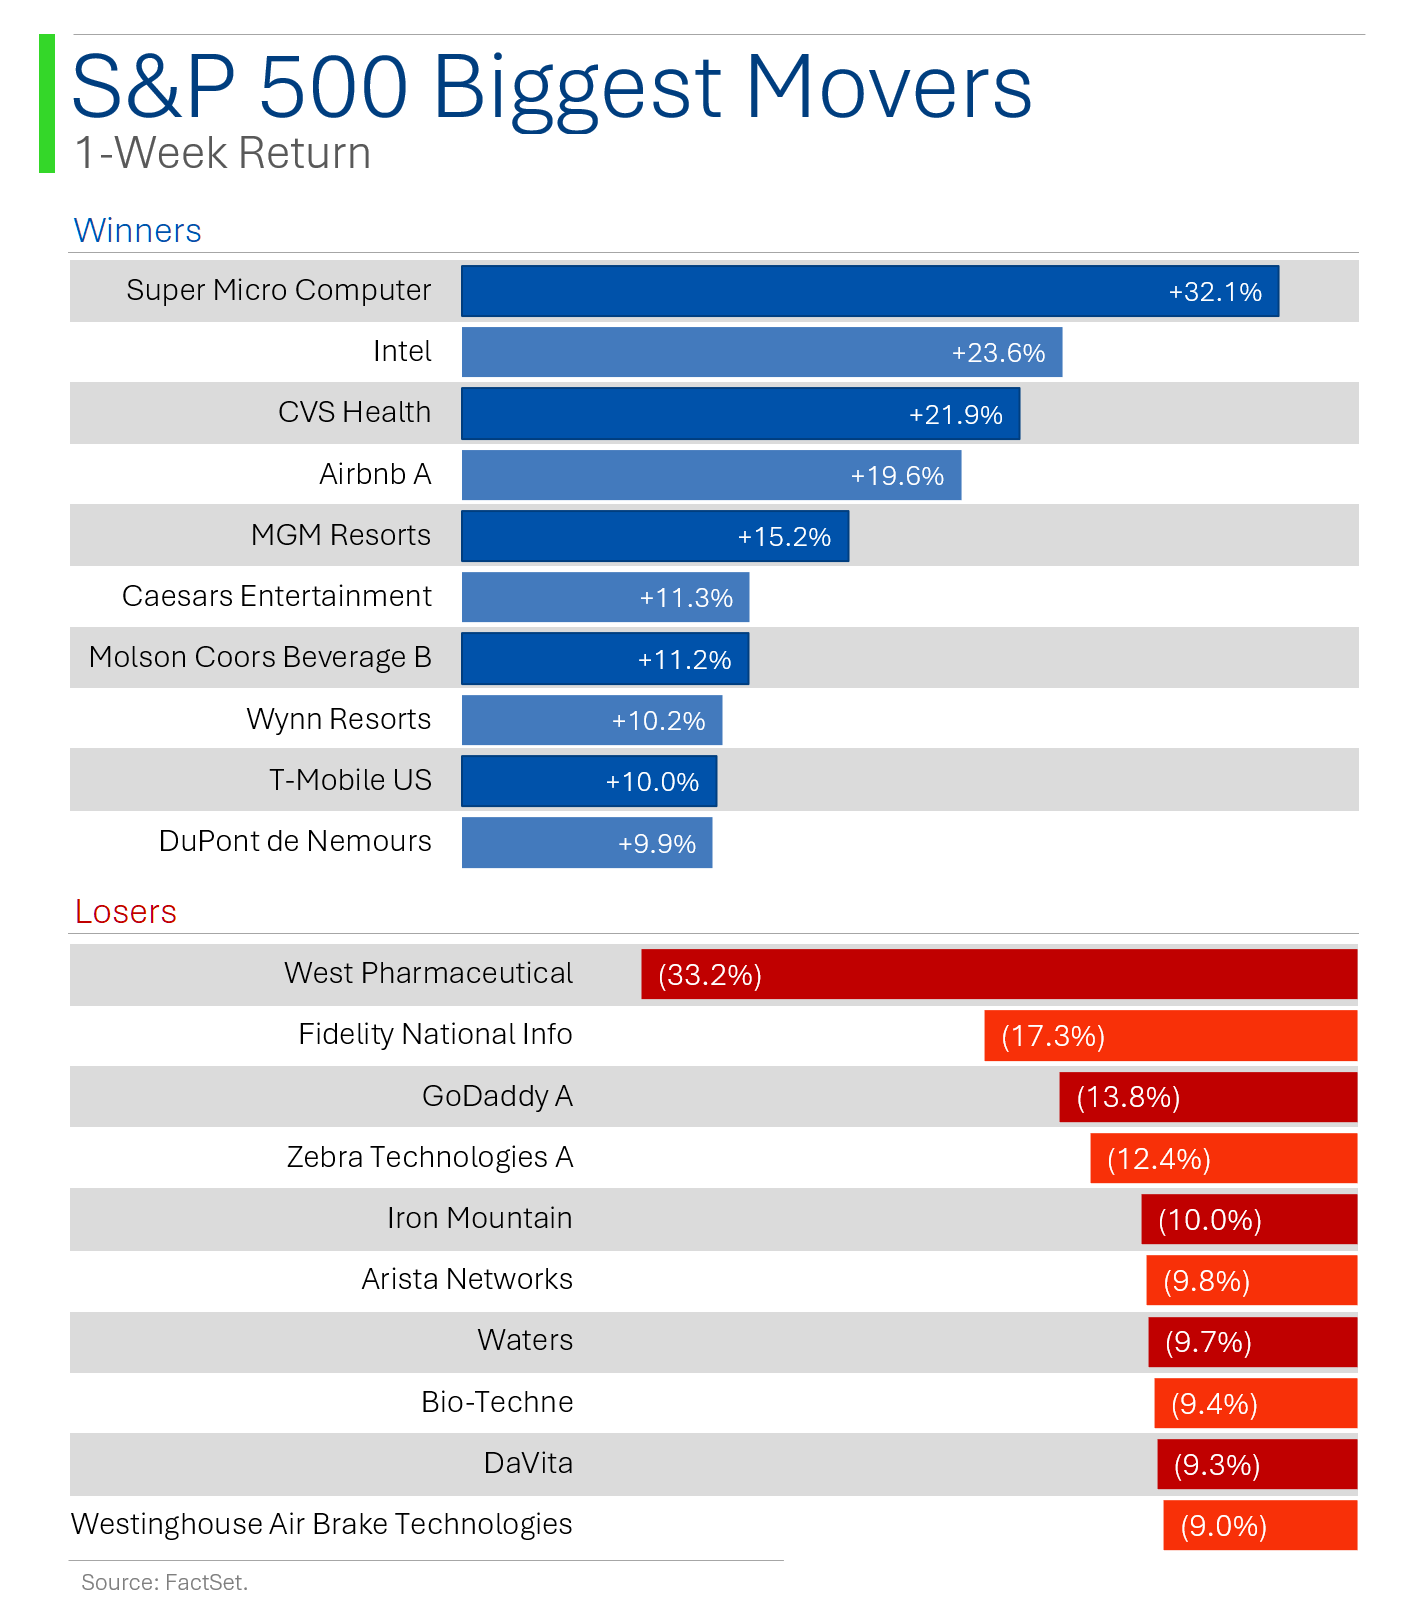
It still feels like 2025 is just starting out, but as you can see above, some companies have already experienced massive pops in their share prices: Uber being near the top of the list.
I haven’t really talked about Uber much because, despite being around for over 15 years, the company just never actually made any money. And I kinda like it when companies do that.
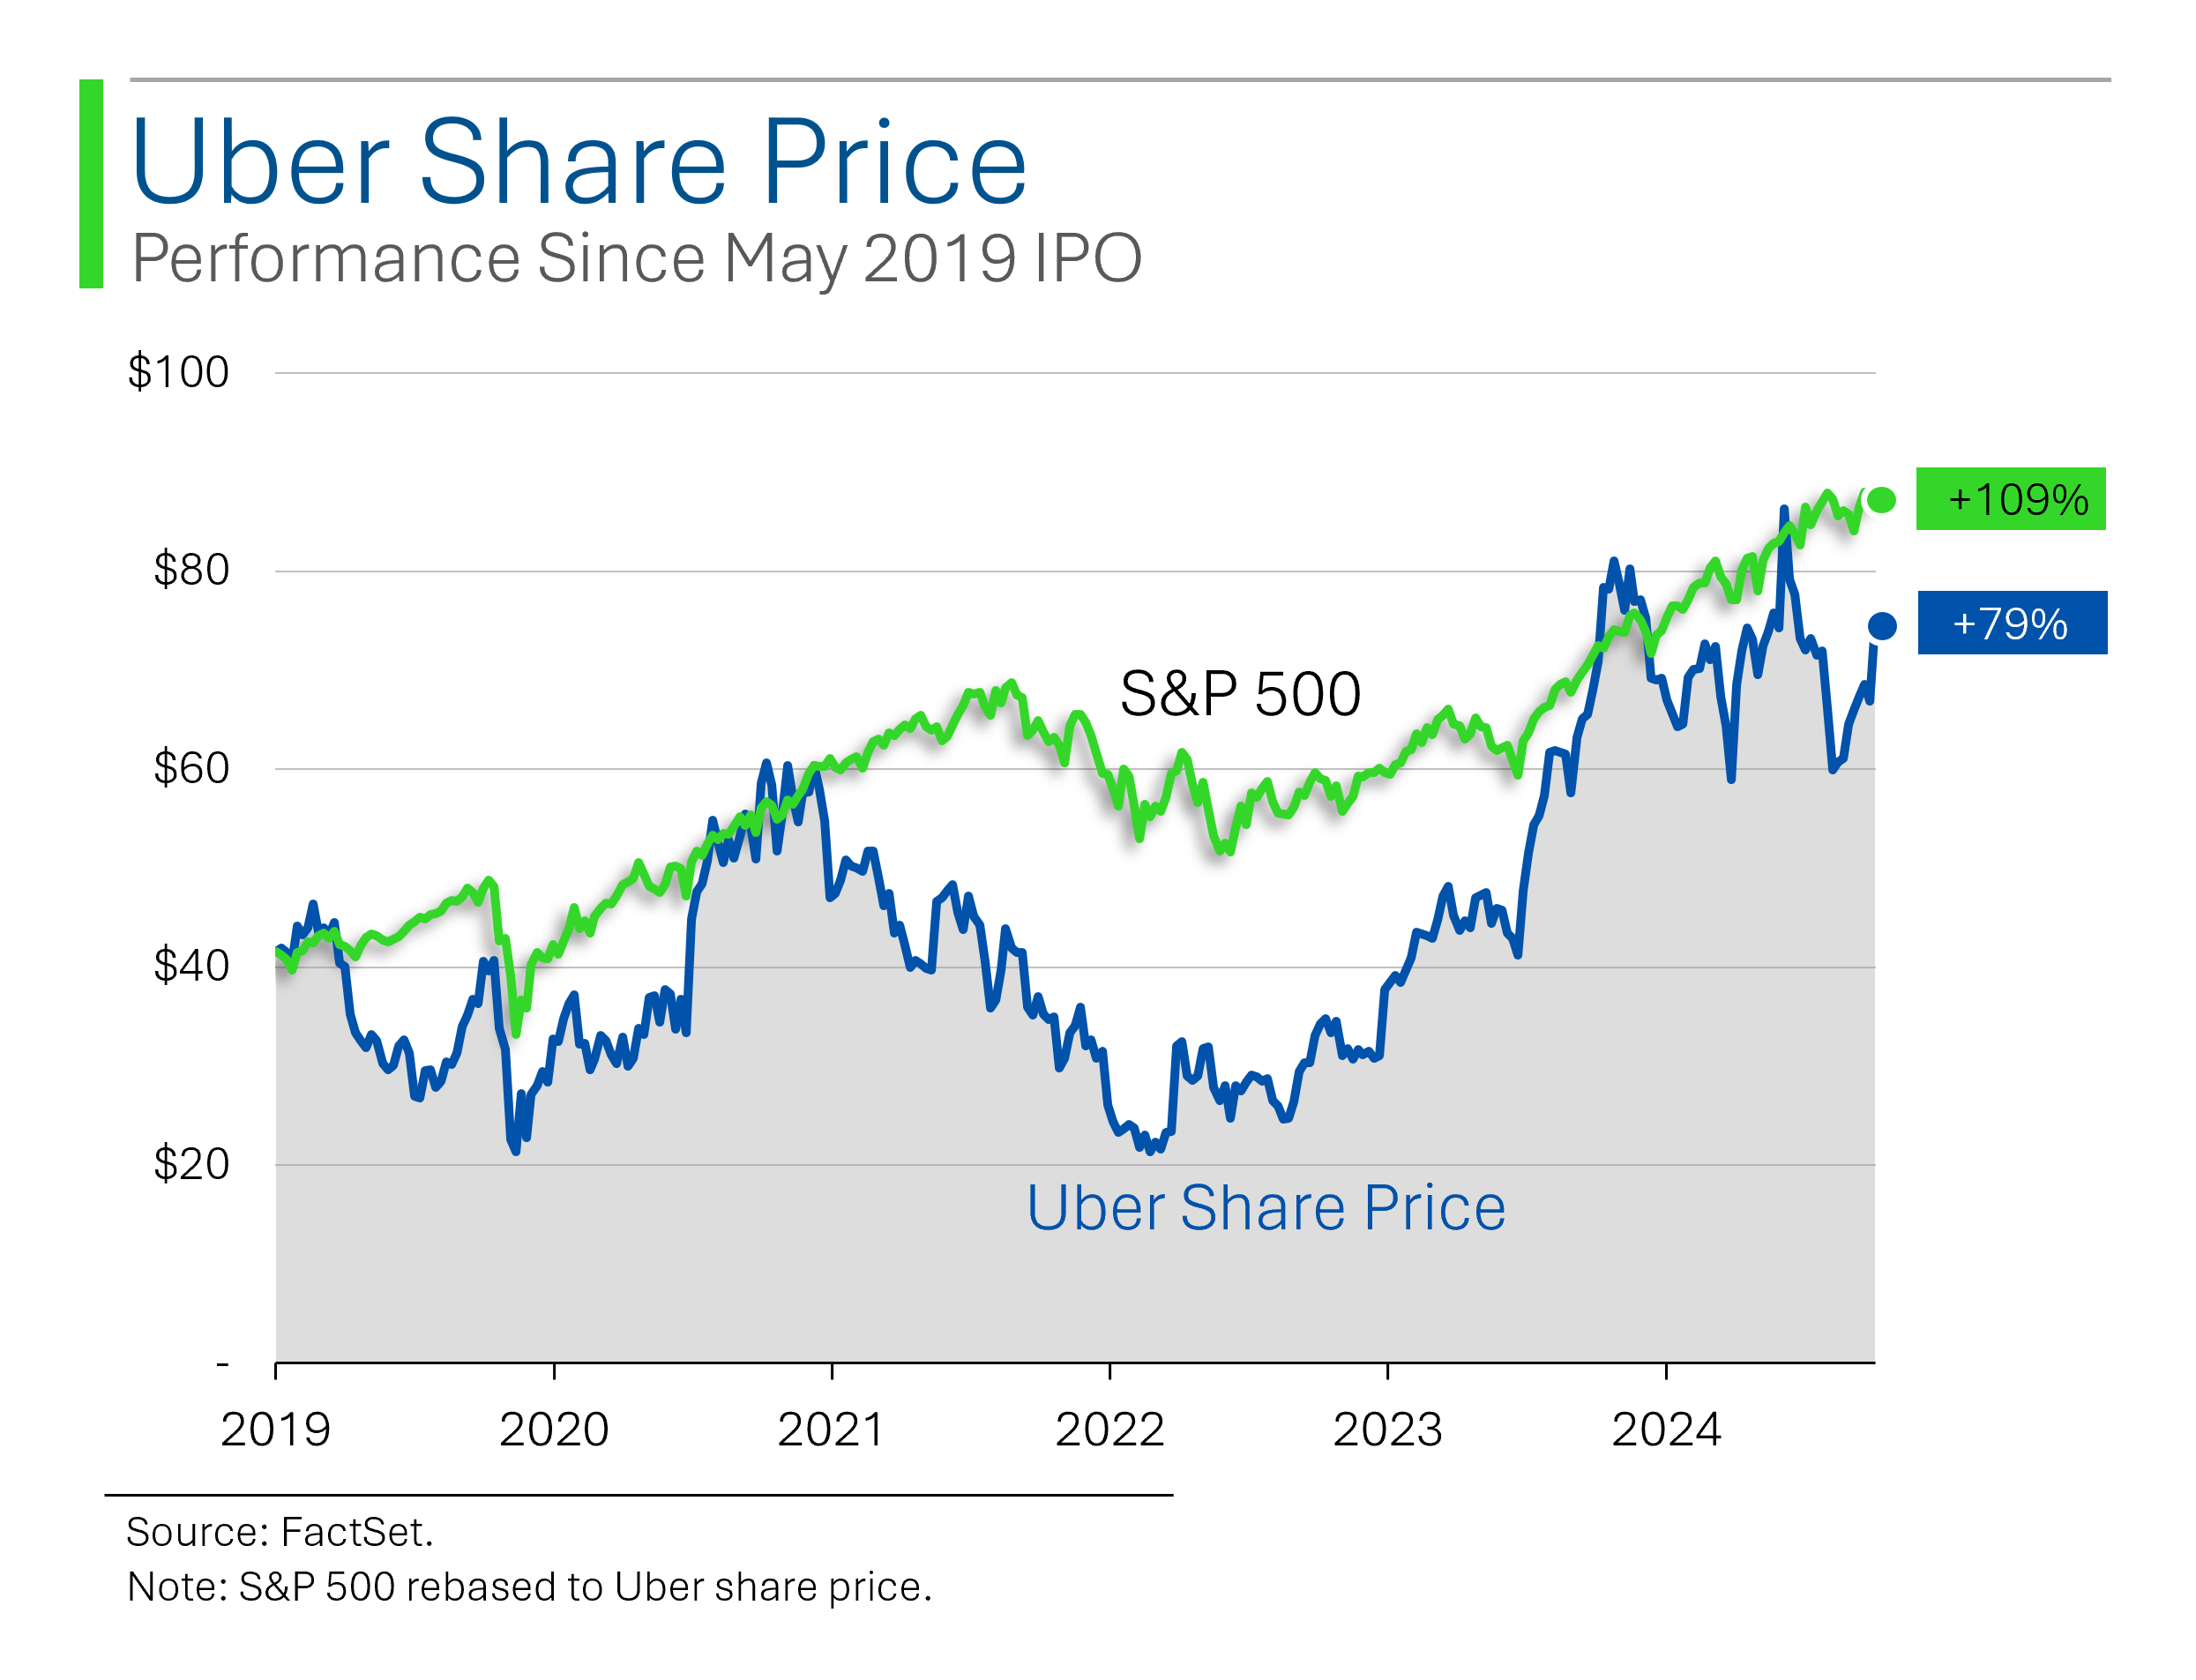
So, despite growing revenues at +25.5% since 2018, the shares have underperformed the market.
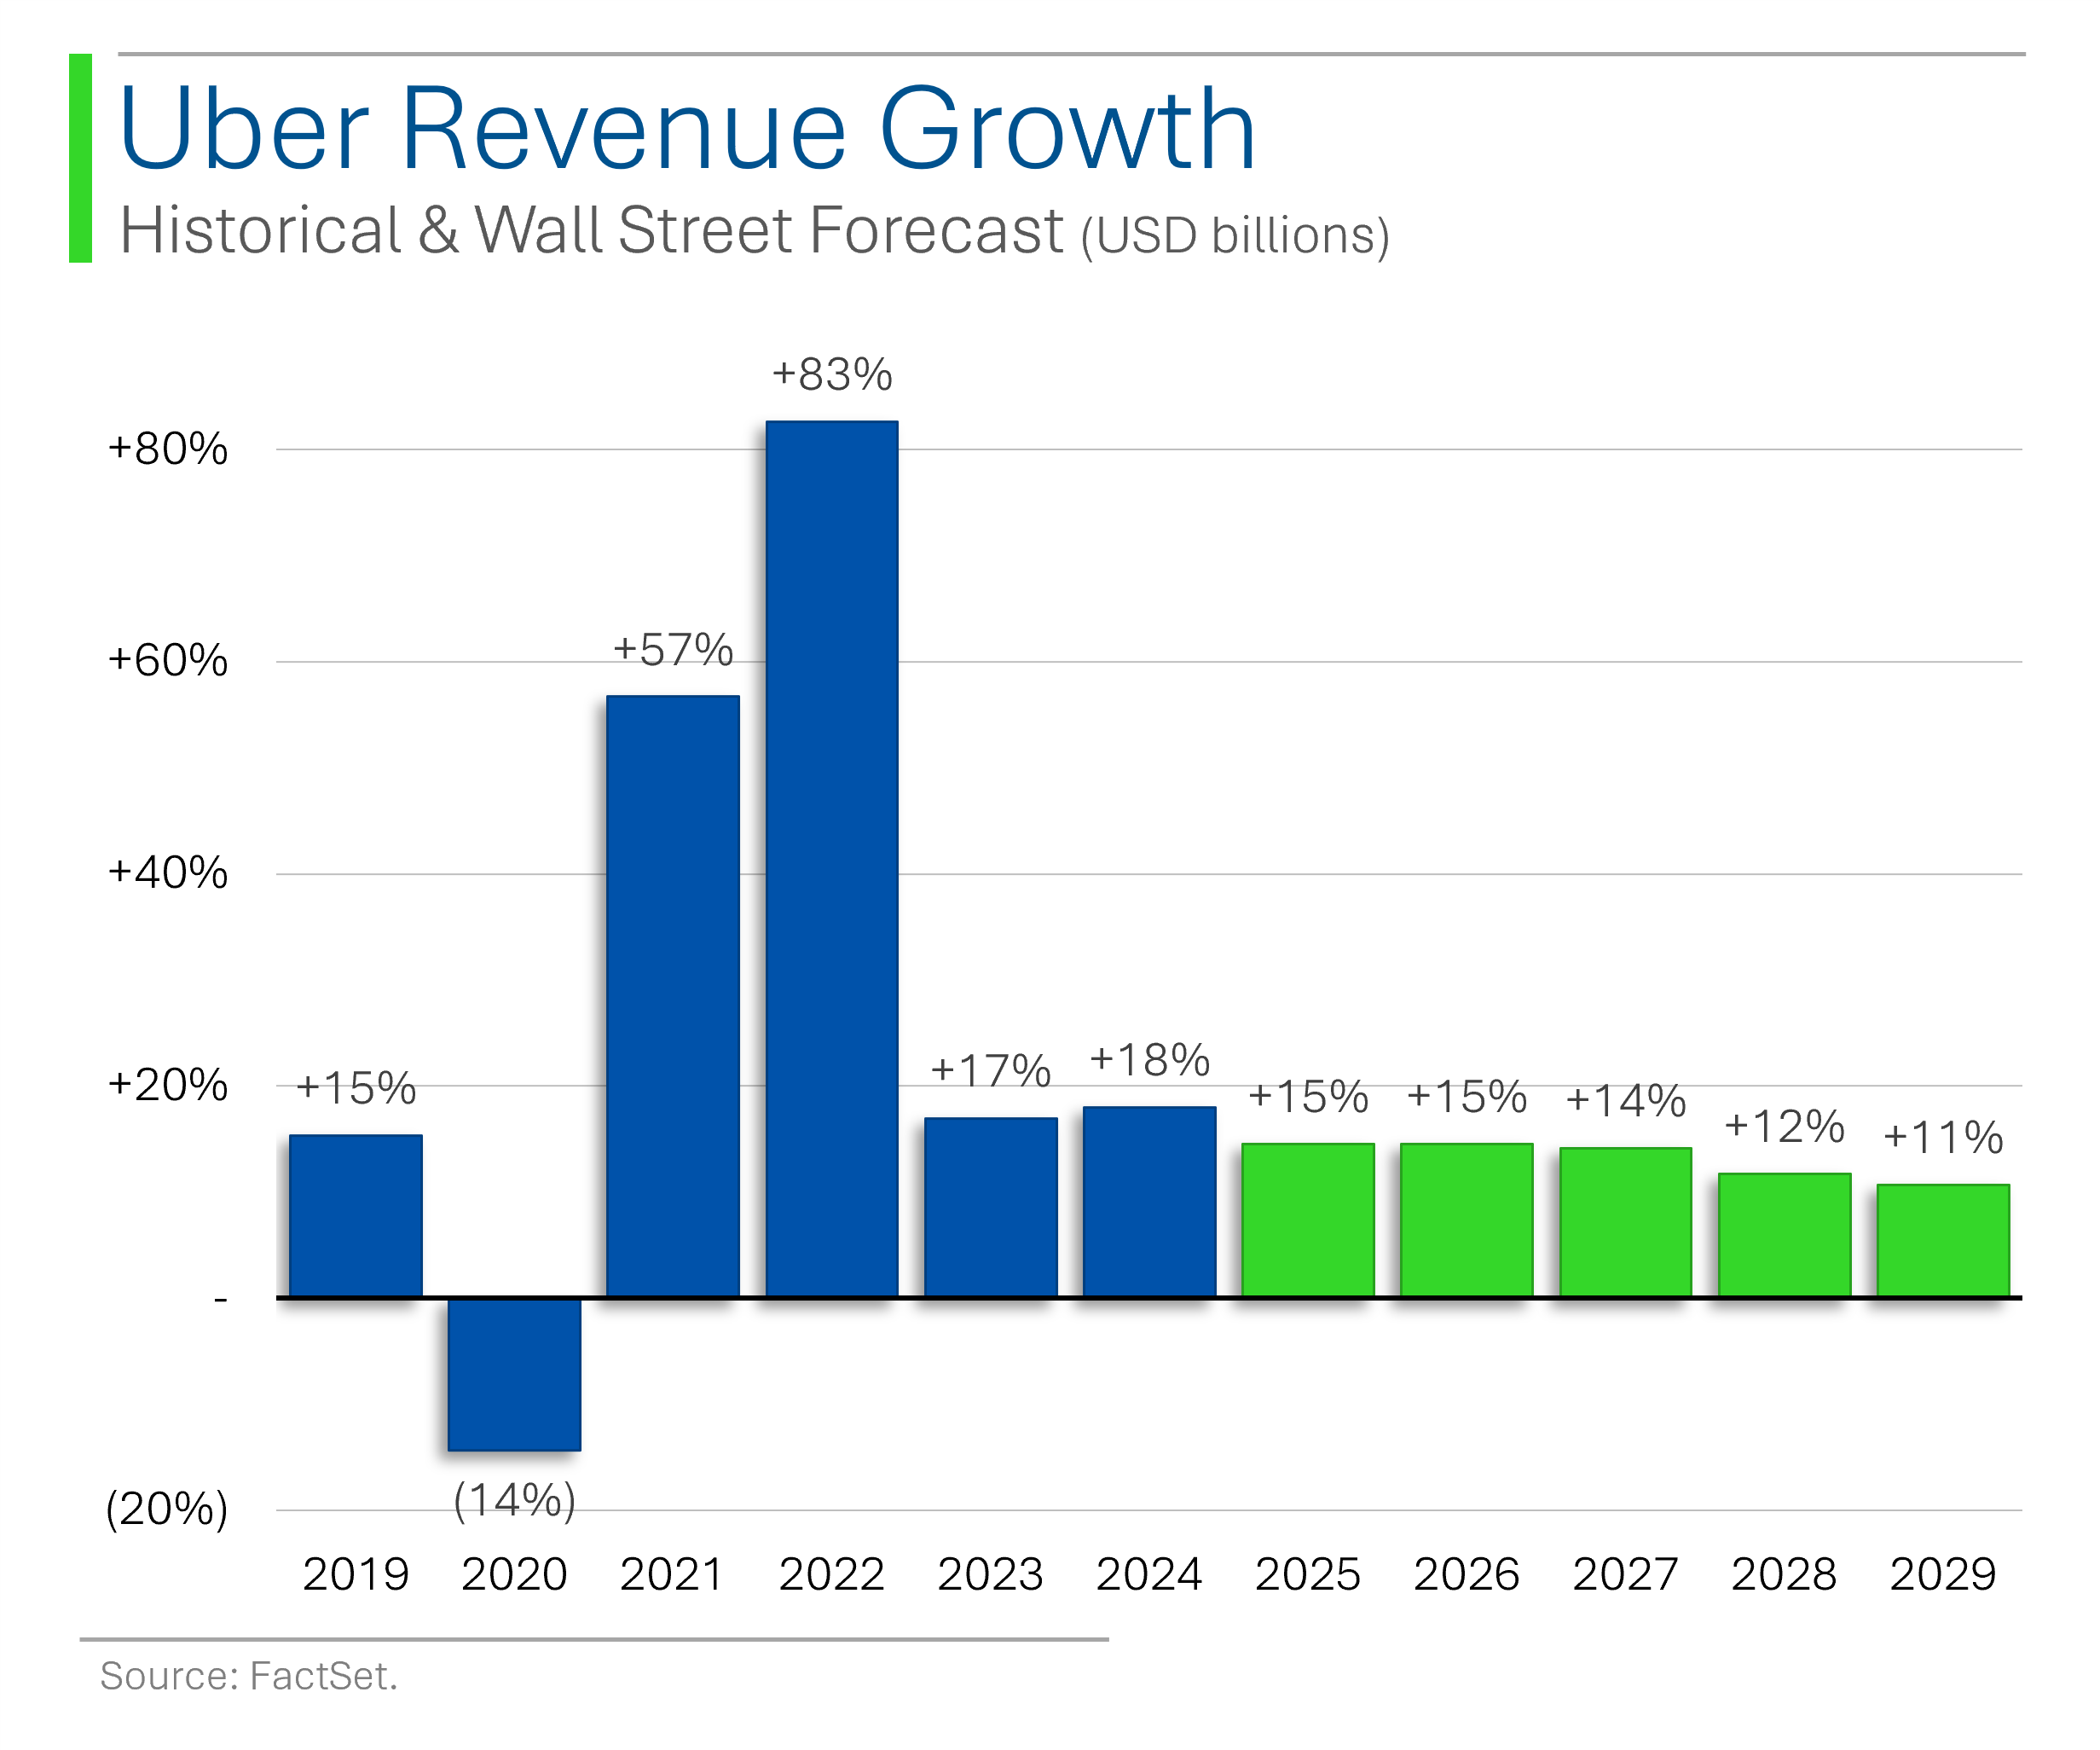
Uber’s biggest growth days are likely in the past but ‘high-teens’ revenue growth the last few years is still pretty darn impressive, and Wall Street expects double-digit growth to continue late into the decade.
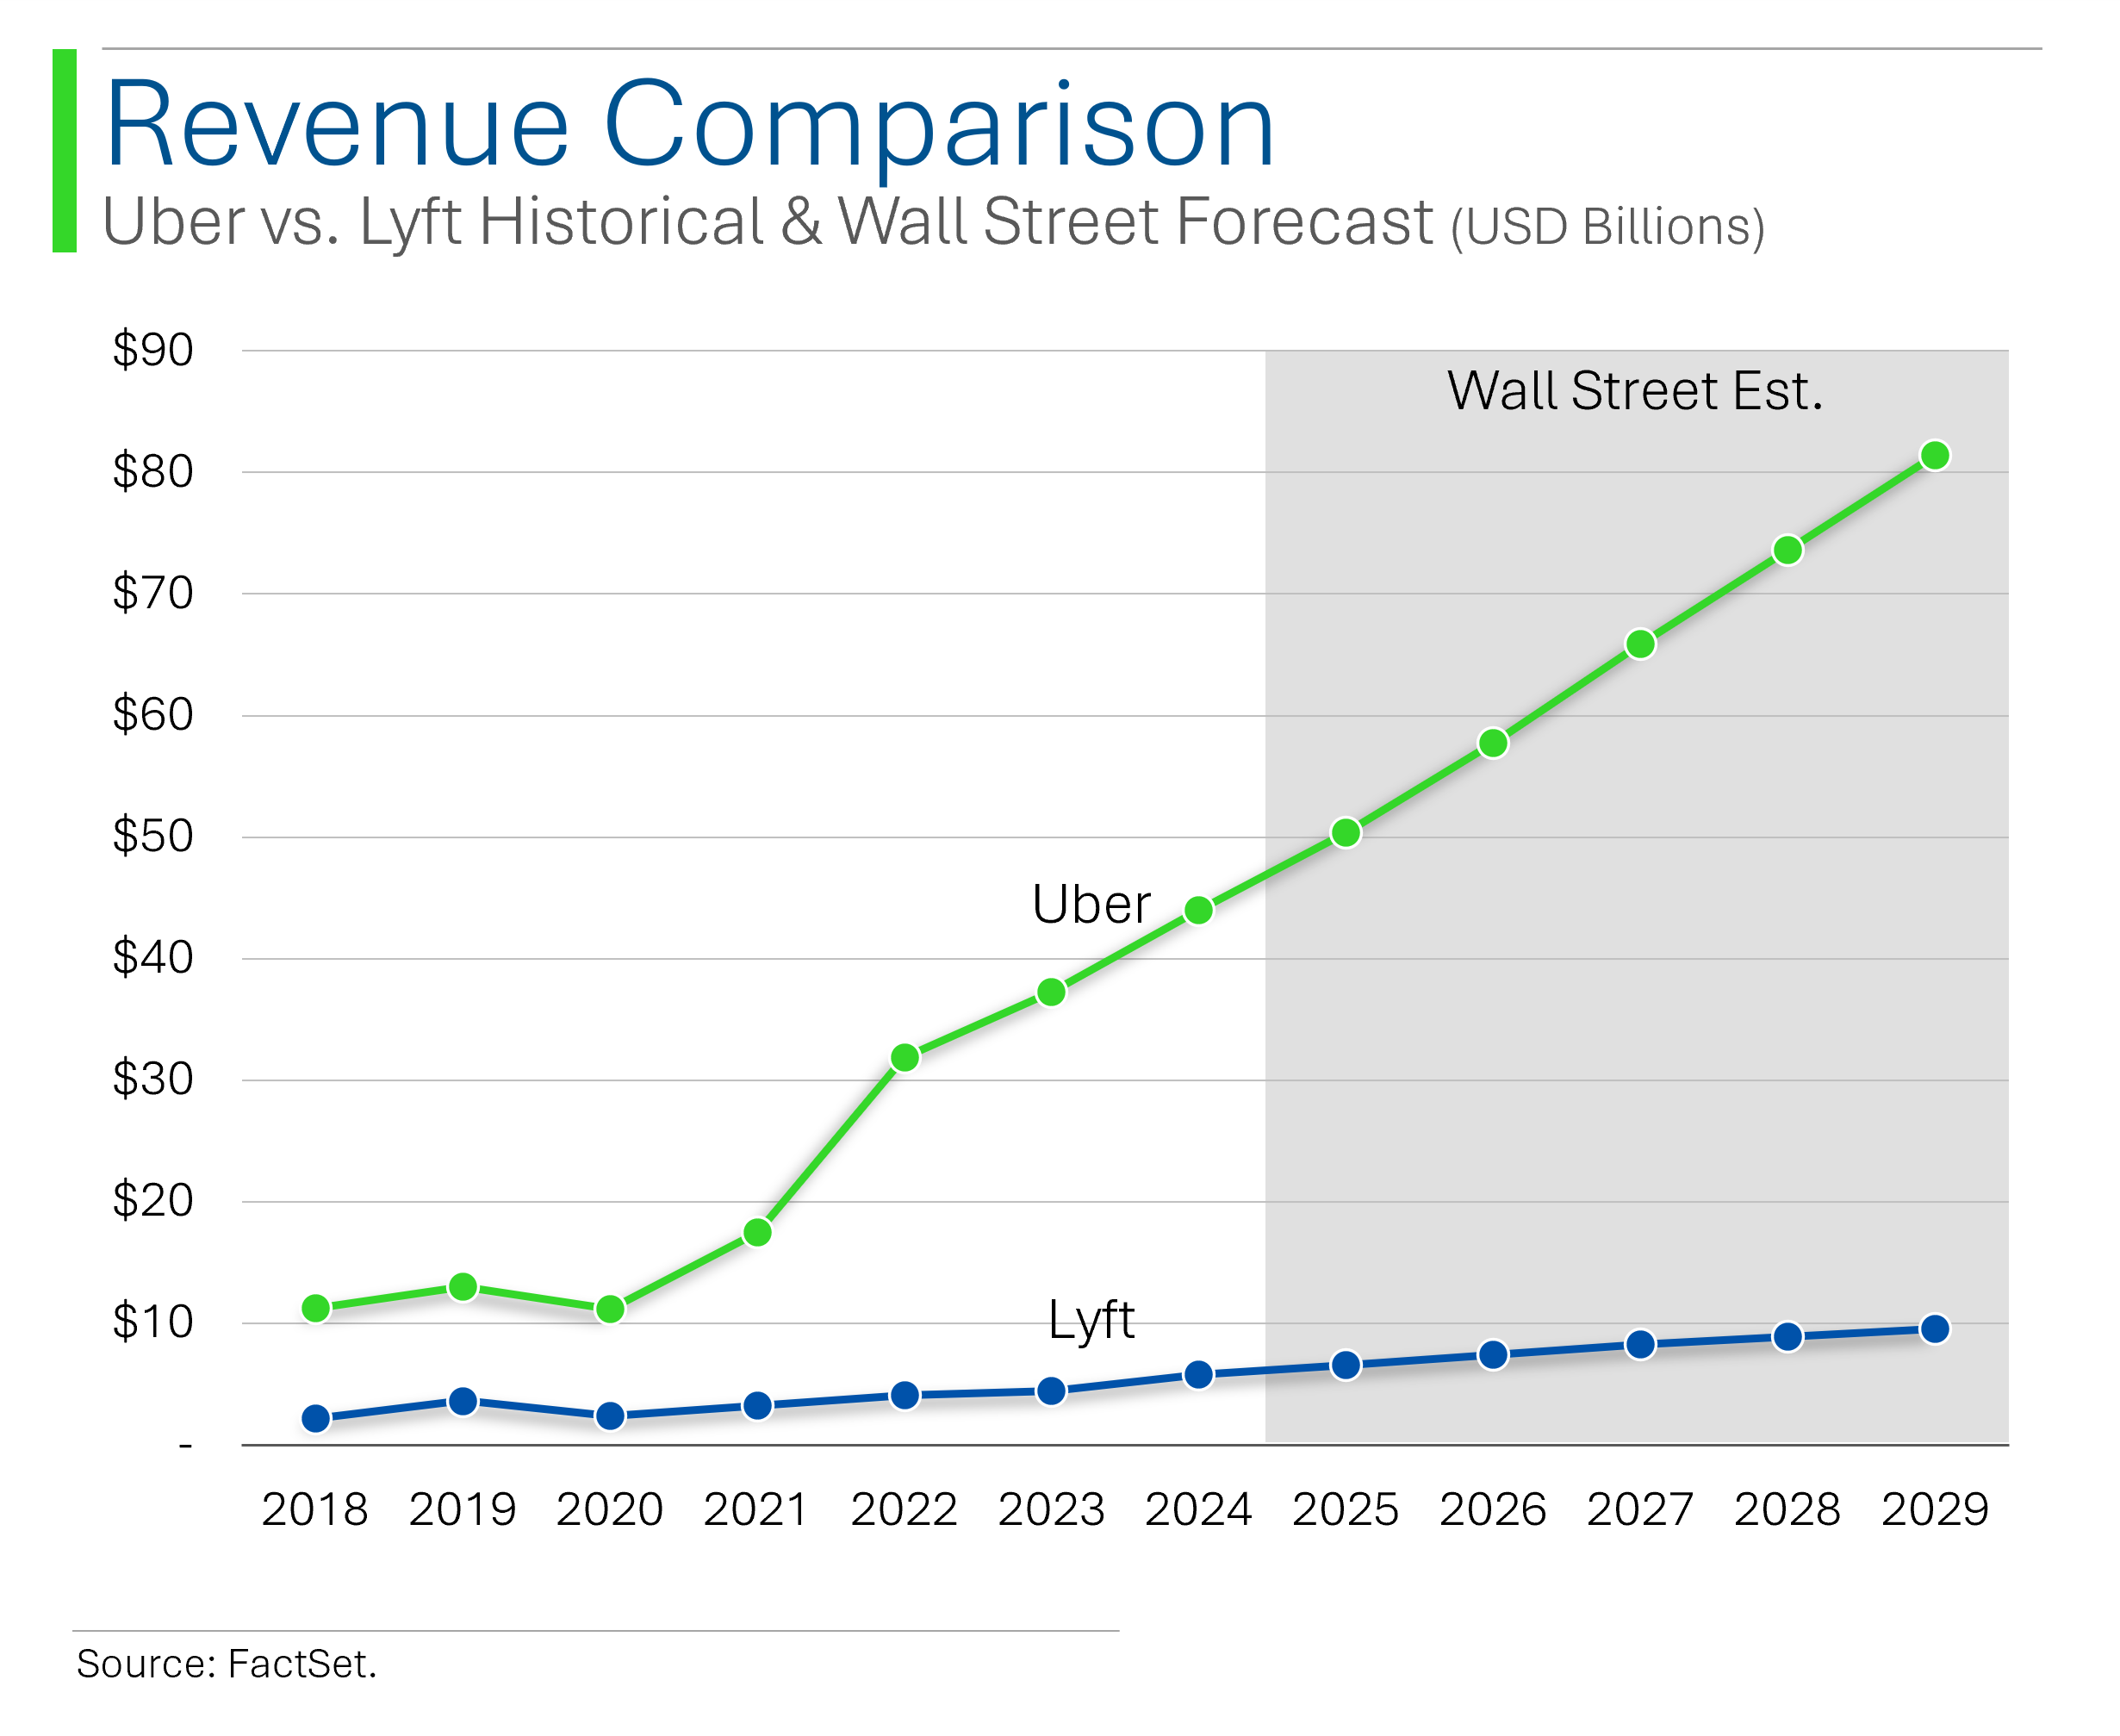
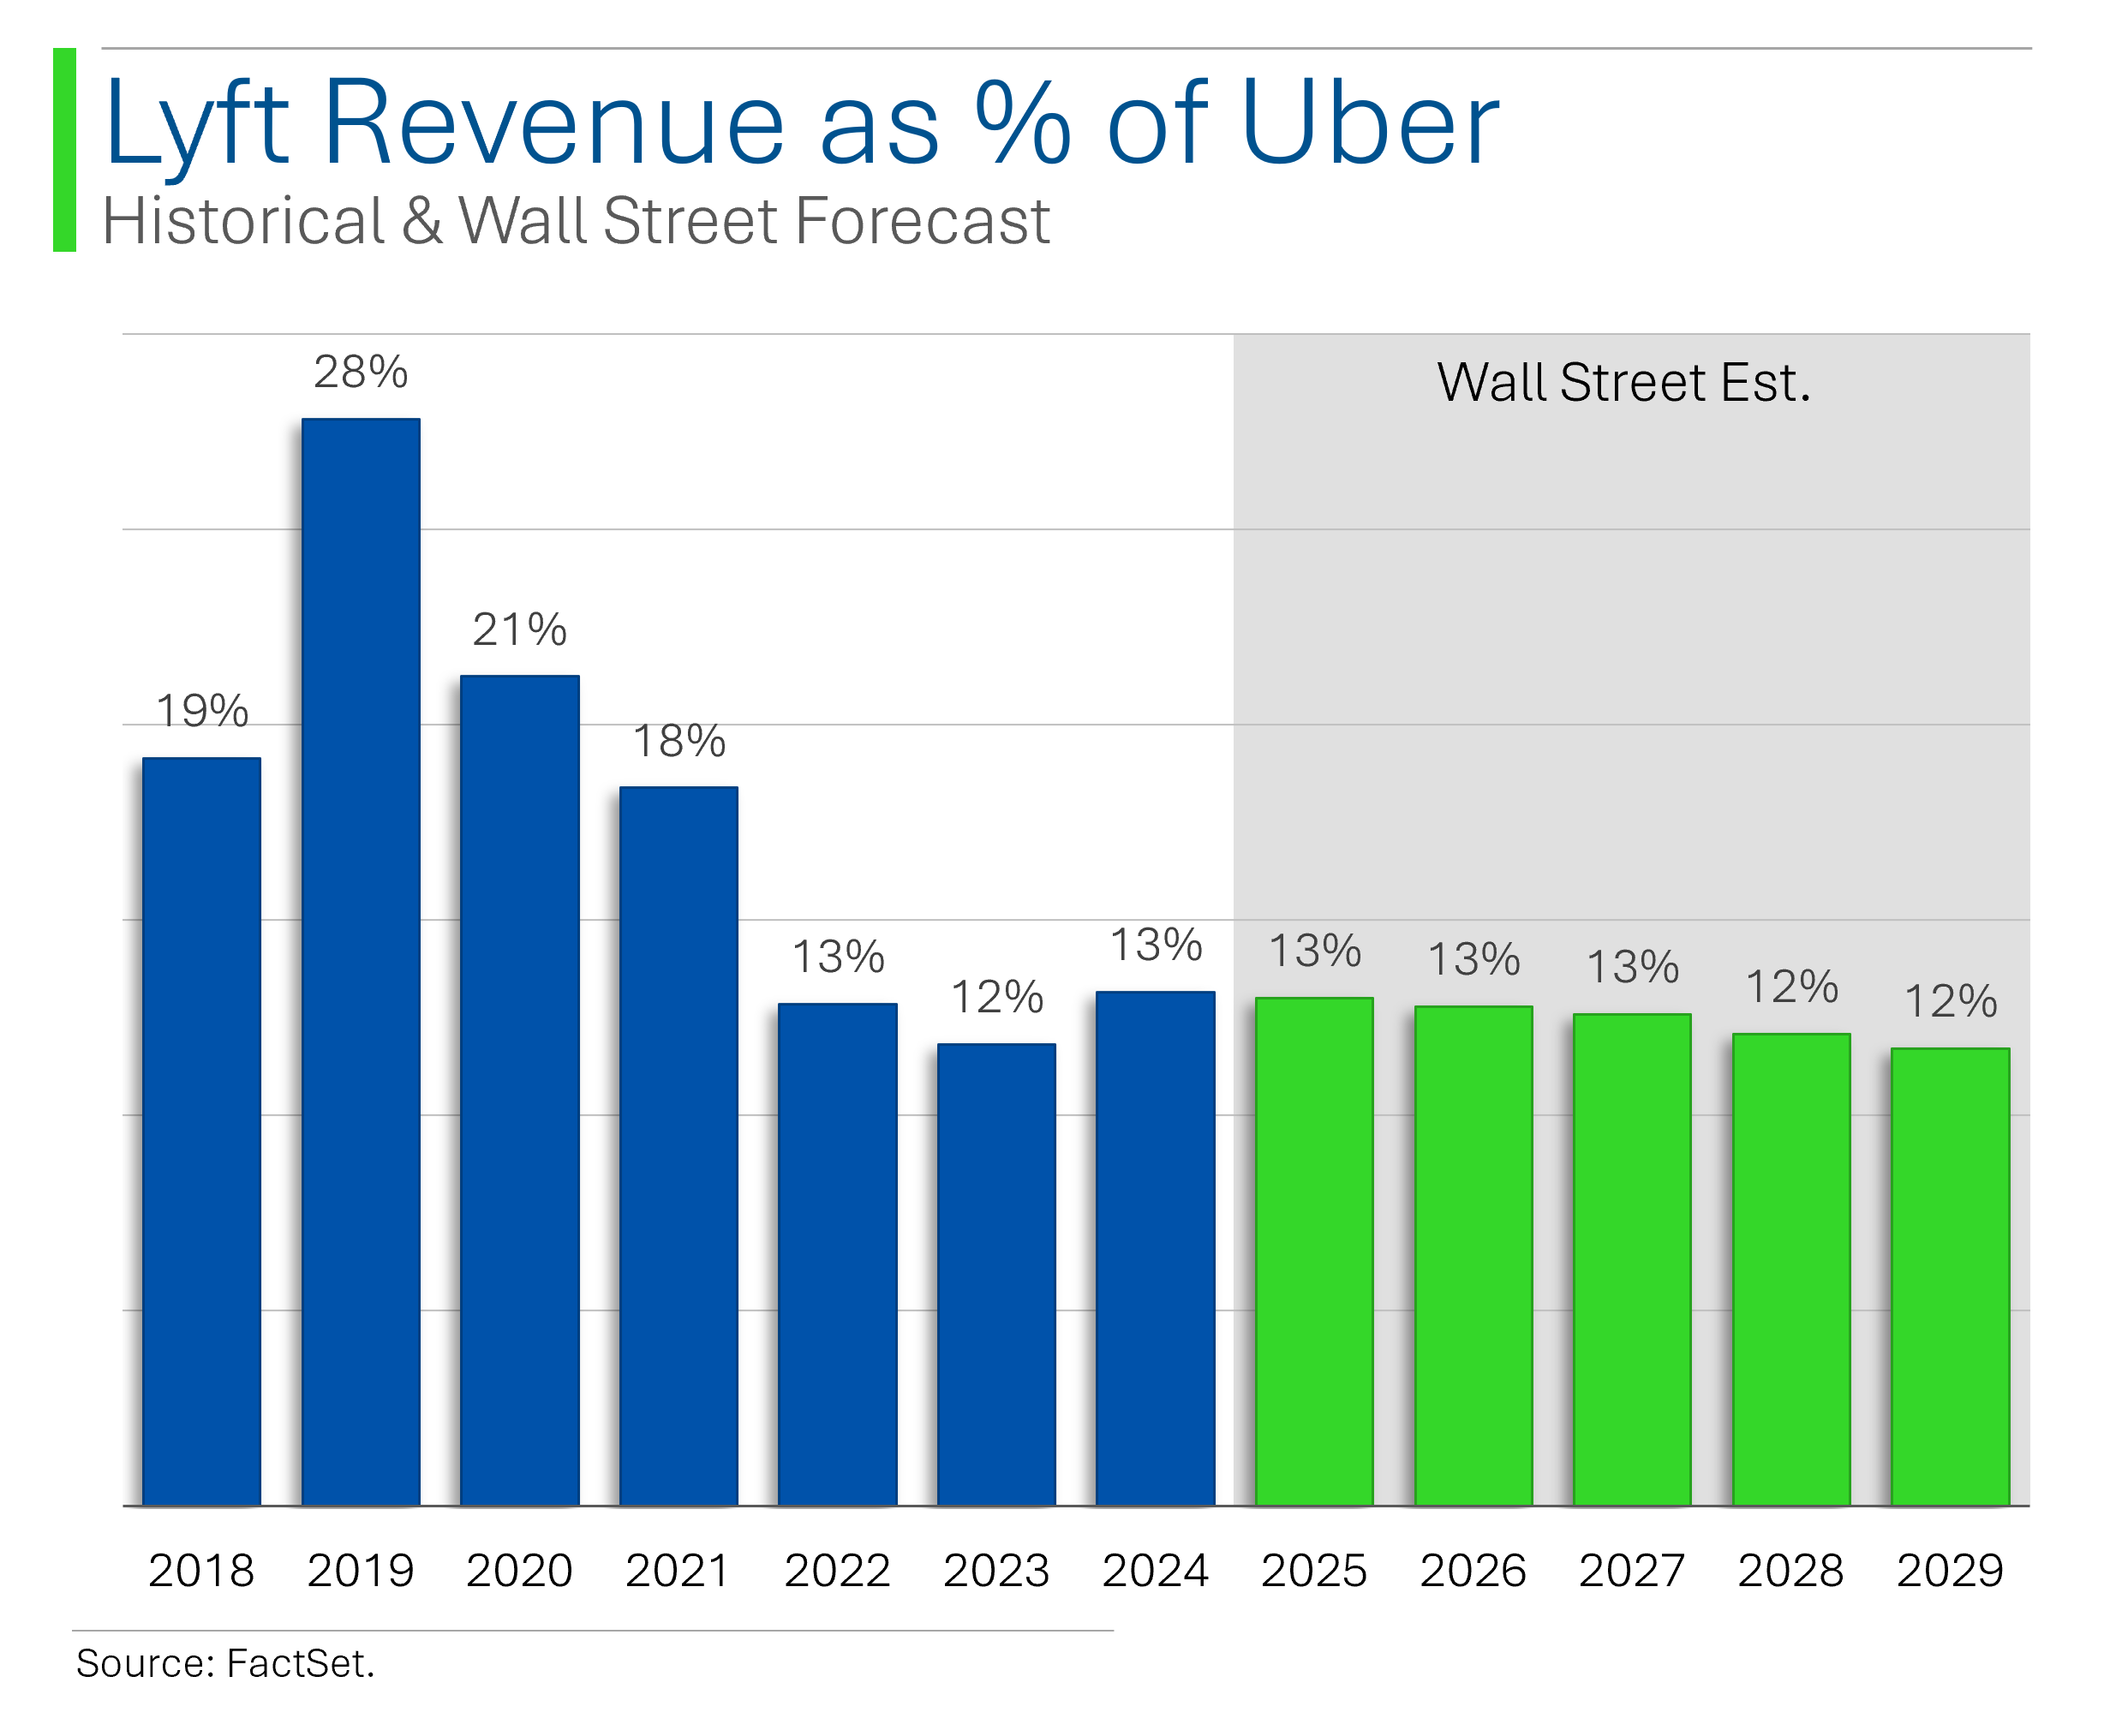
In fact, Uber has only grown its position as the dominant player in the west. Lyft was once touted as being a potential foil to Uber: One that could potentially overtake the king one day.
Since closing the gap to just under a third the revenue of Uber by 2019 (28%), Lyft’s revenue now sits at less than half of that at the end of 2024 (13%).
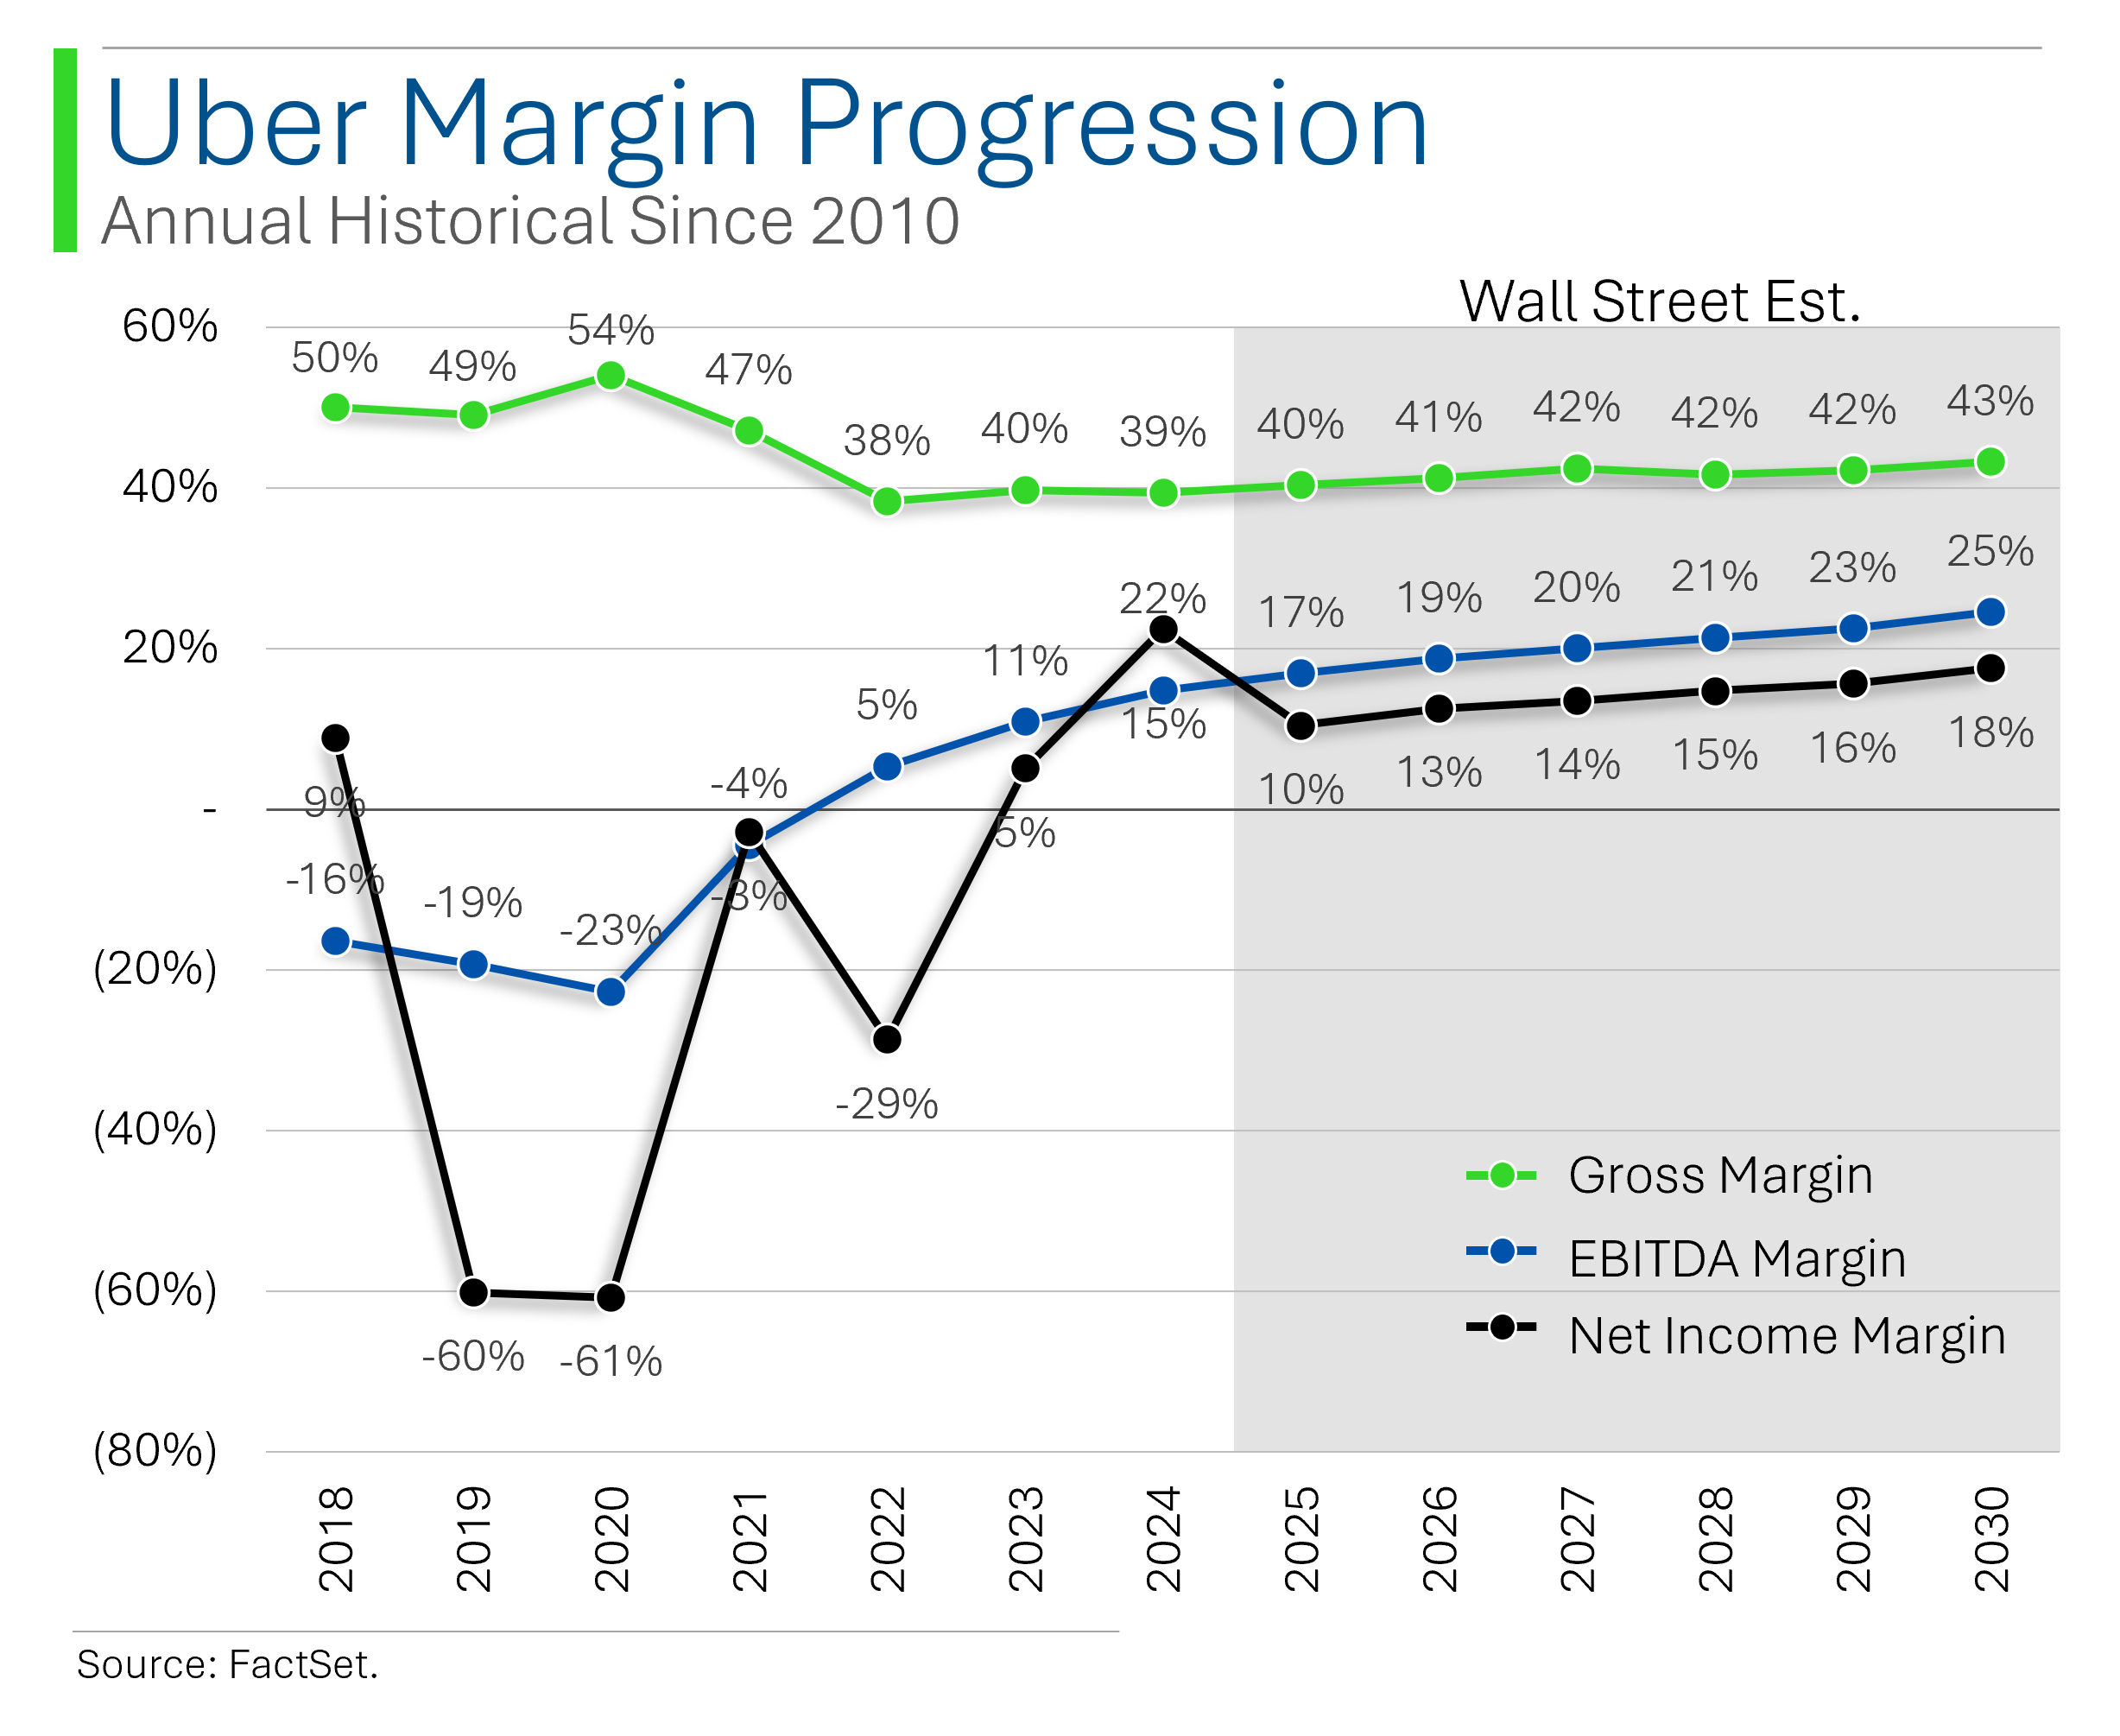
Uber’s transformation into a ‘real company’ is probably best seen in its margins. A double-digit Net Income Margin is most impressive, especially for a company that only a few years ago seemed allergic to profitability.

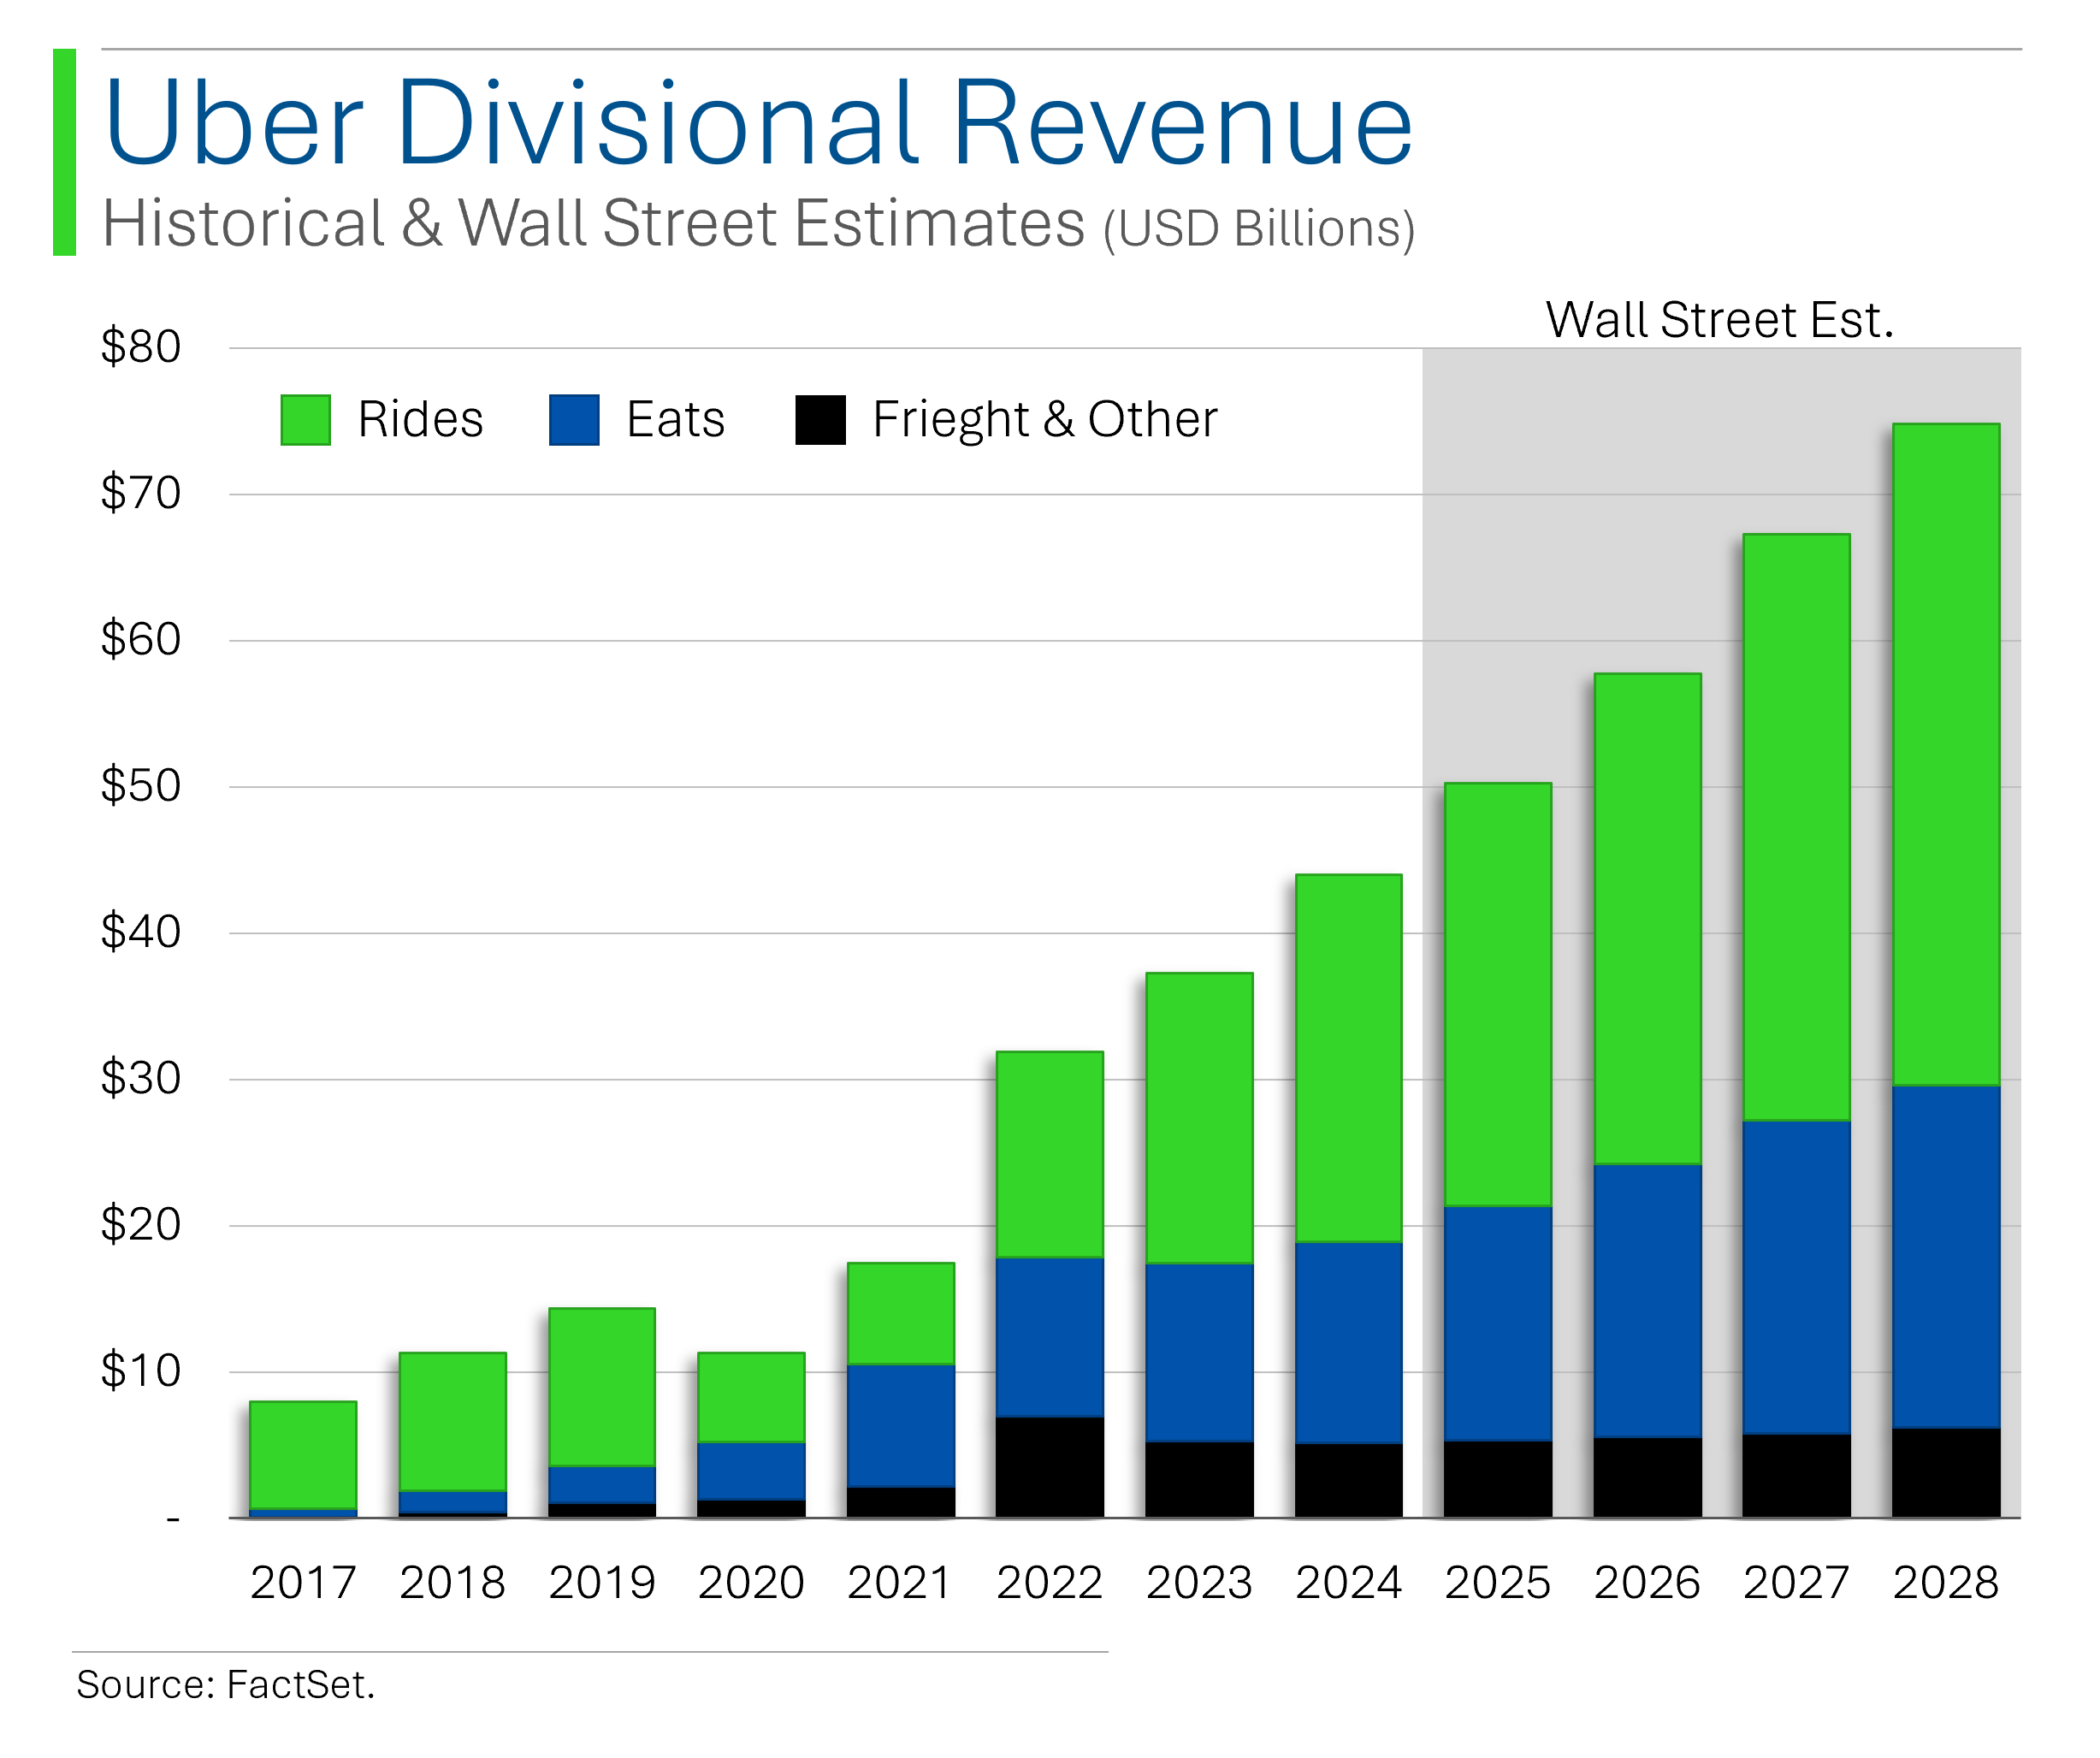
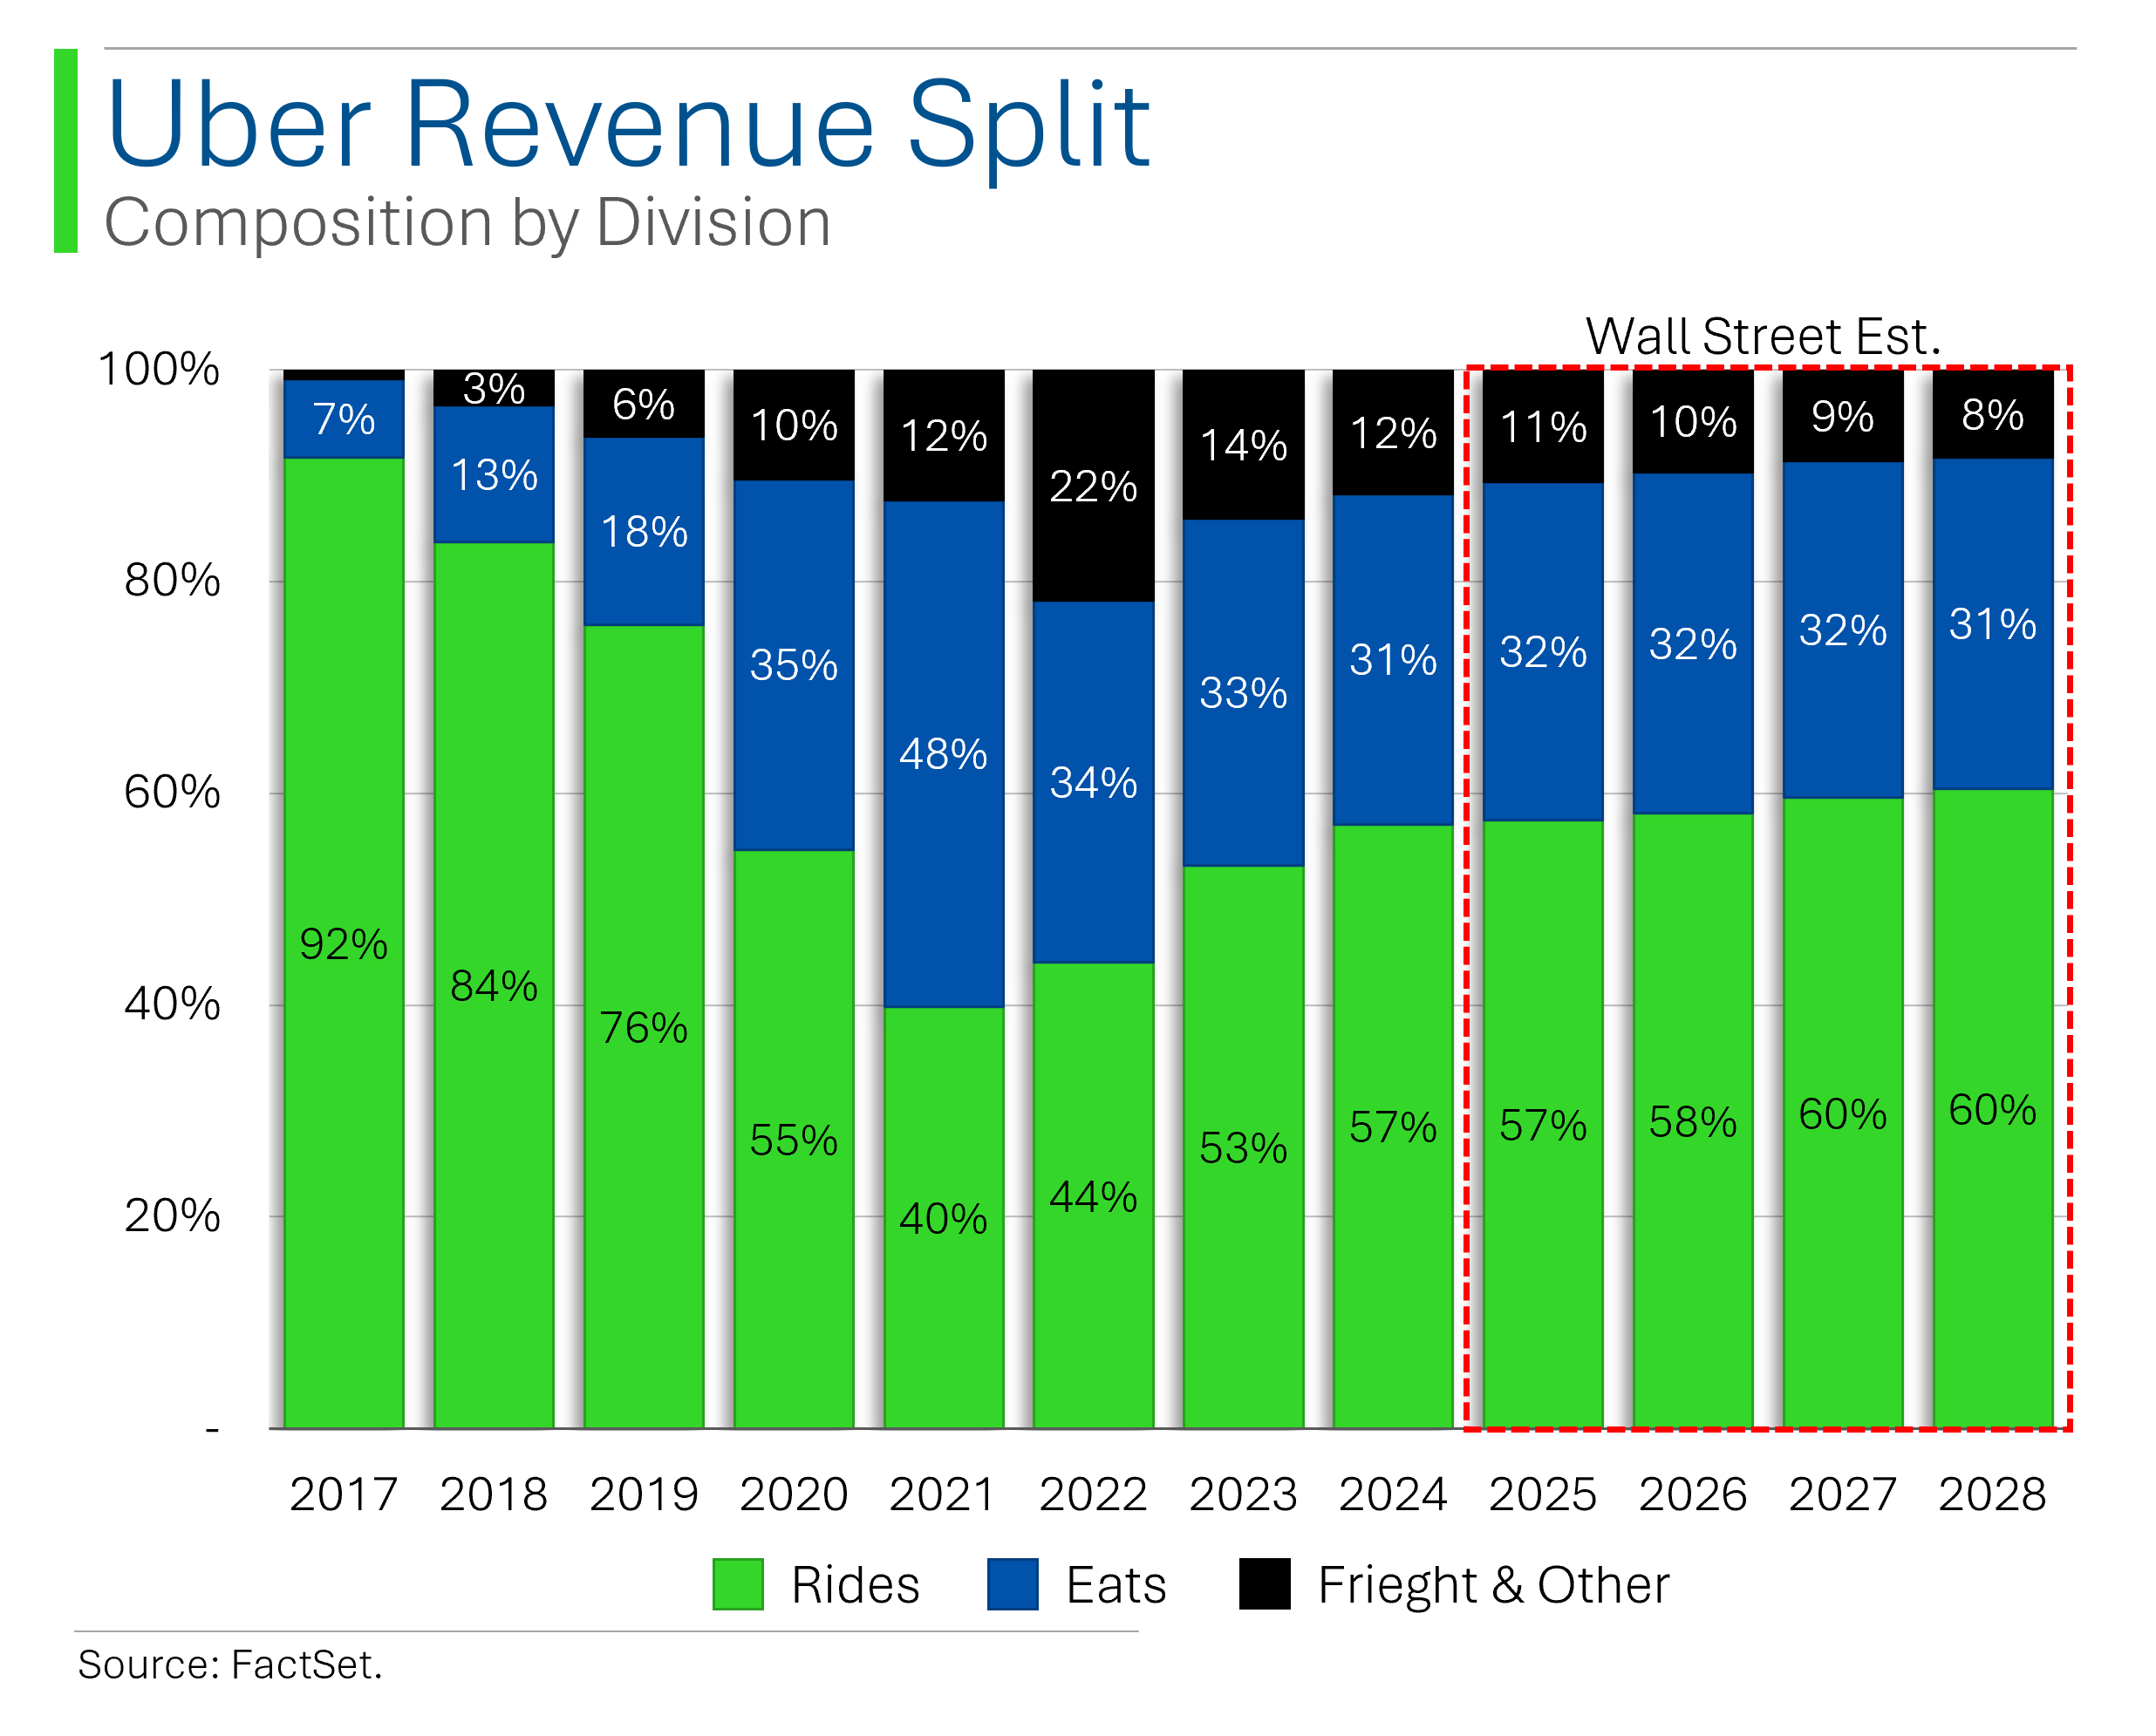
Uber’s diversification into Eats and Freight is expected to continue to add nicely to growth, but Rides is still the dominant contributor.
This is partly the result of them being a dominant player in less competitive ride-hailing, while food delivery continues to be an extremely competitive landscape to navigate.
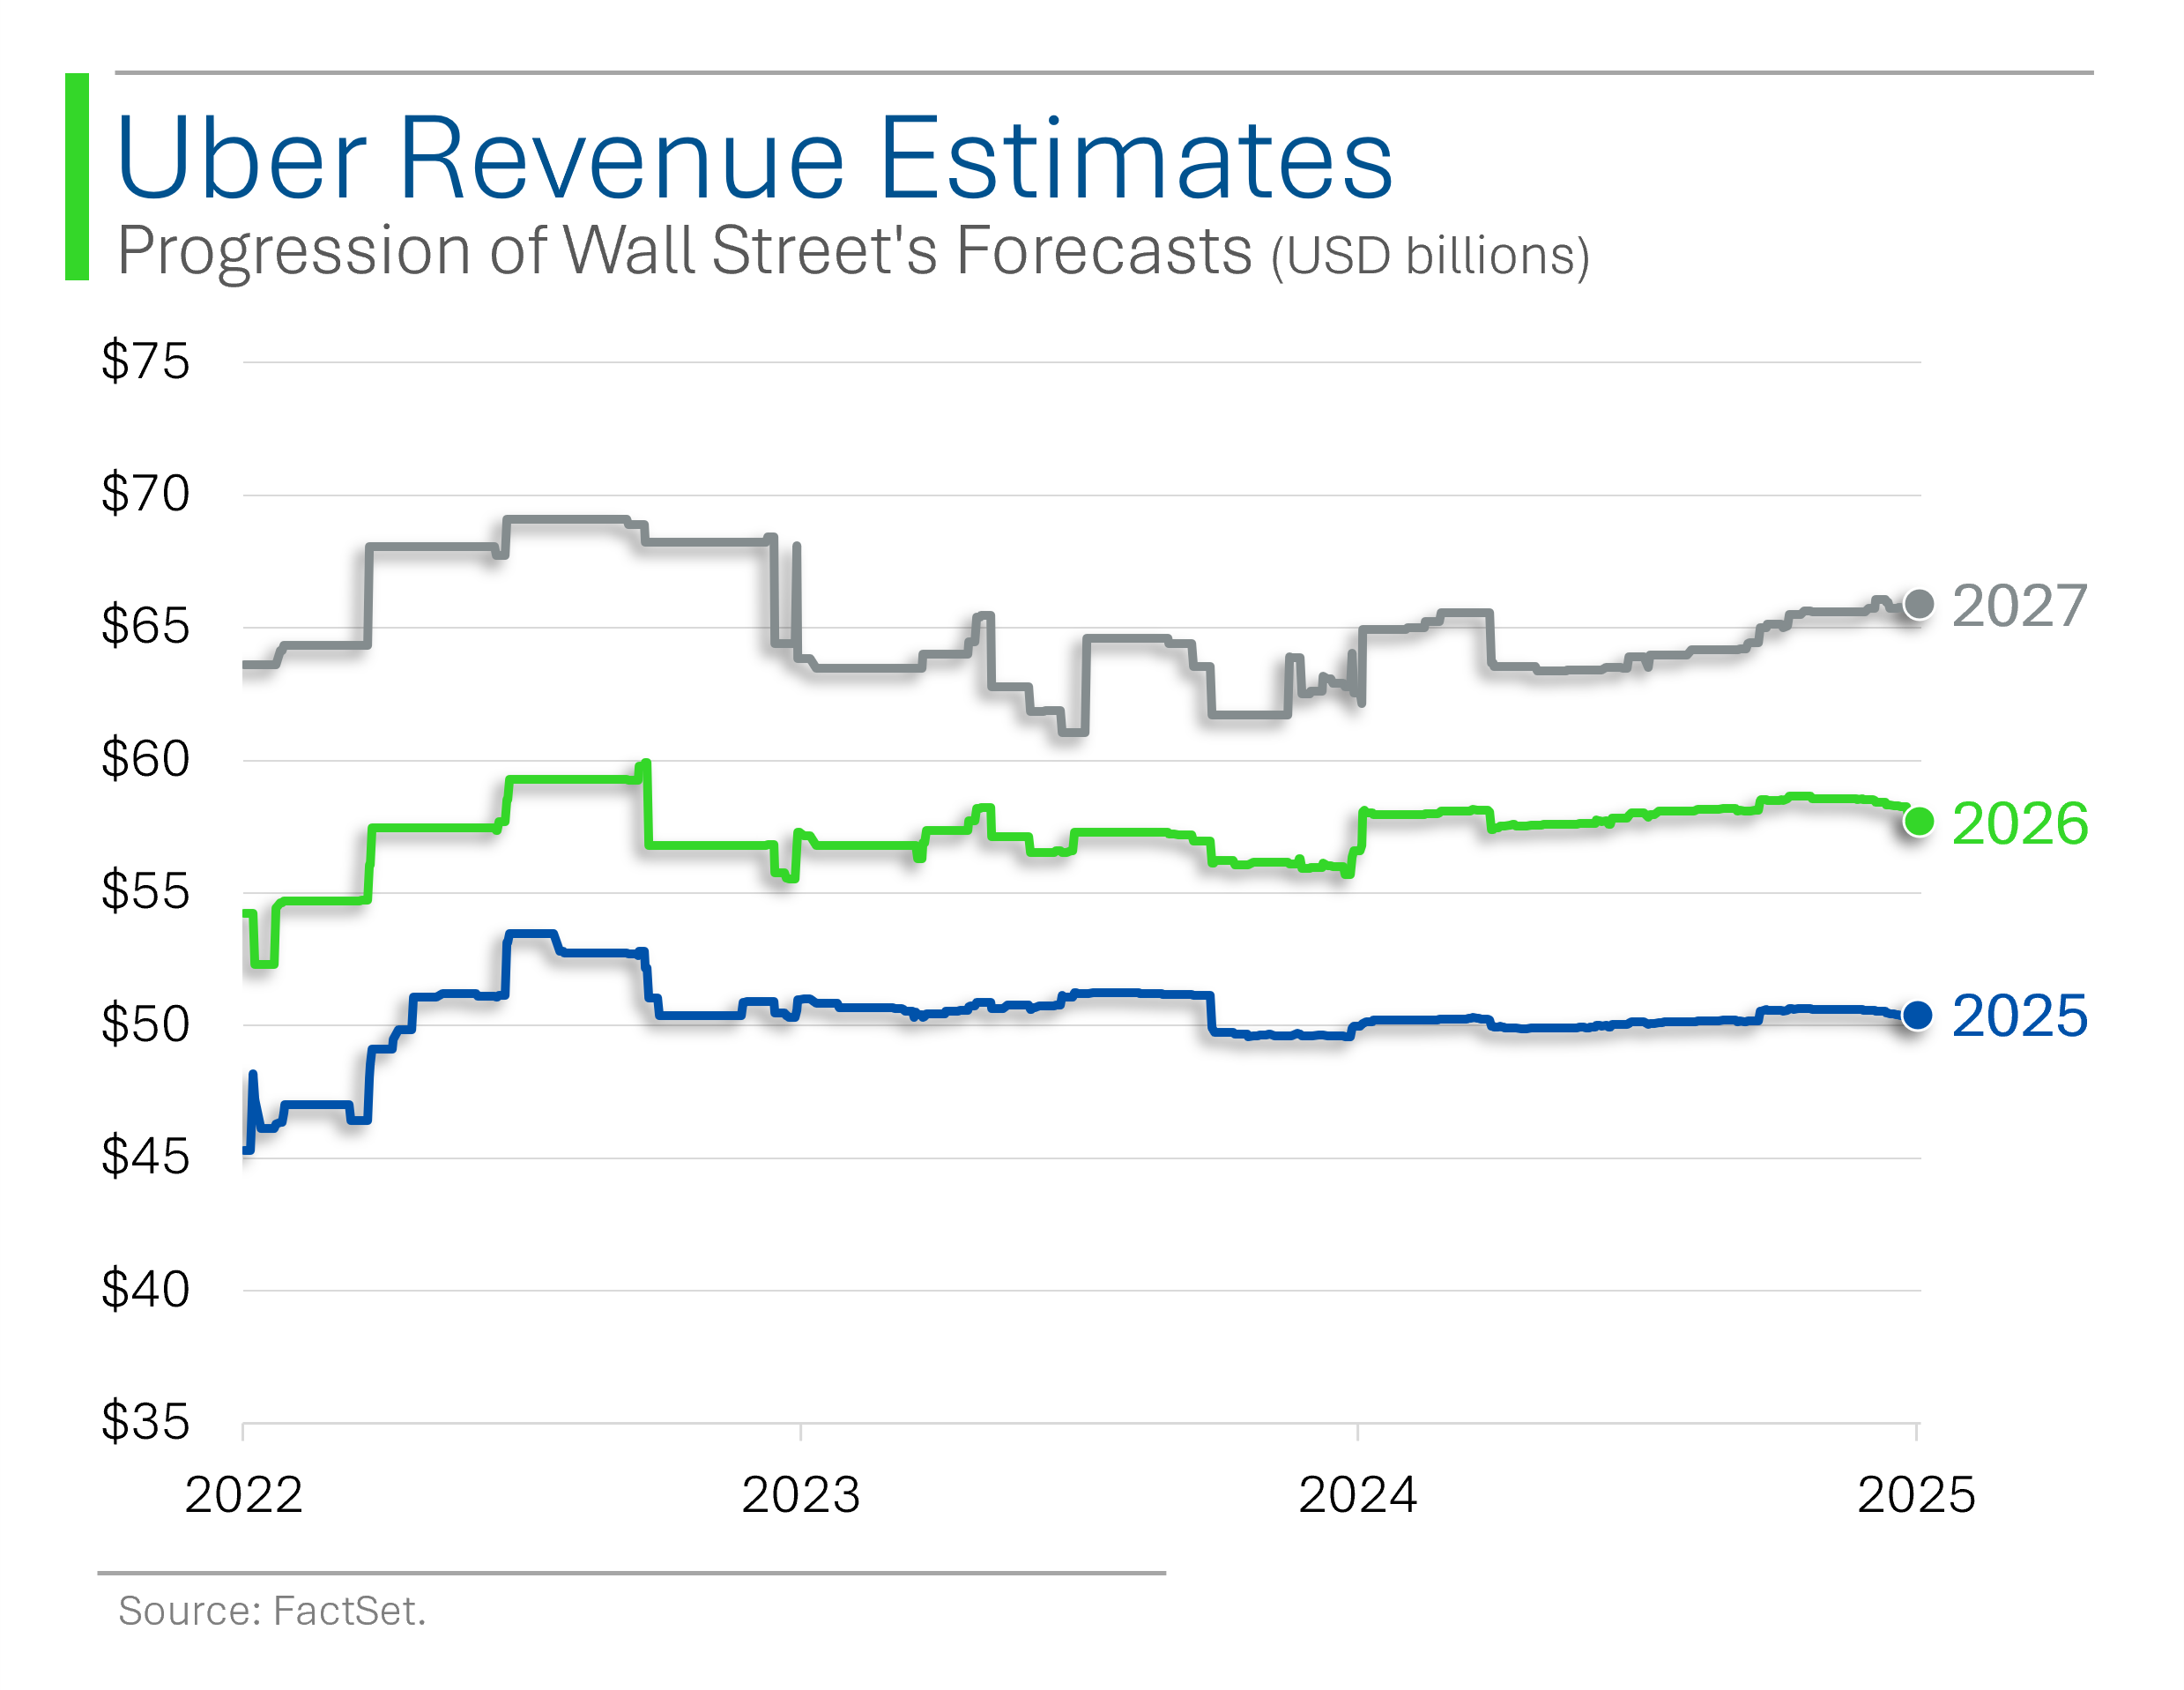
While Wall Street estimates are still a bit off their 2022 peaks, given how much has changed in the world since then - both for the better and for worse for Uber - little has actually moved the estimates.
Given Uber’s volatile past, I’m a little shocked that estimates for medium-term revenues have proved infinitely more stable than even Walmart’s or Disney’s.
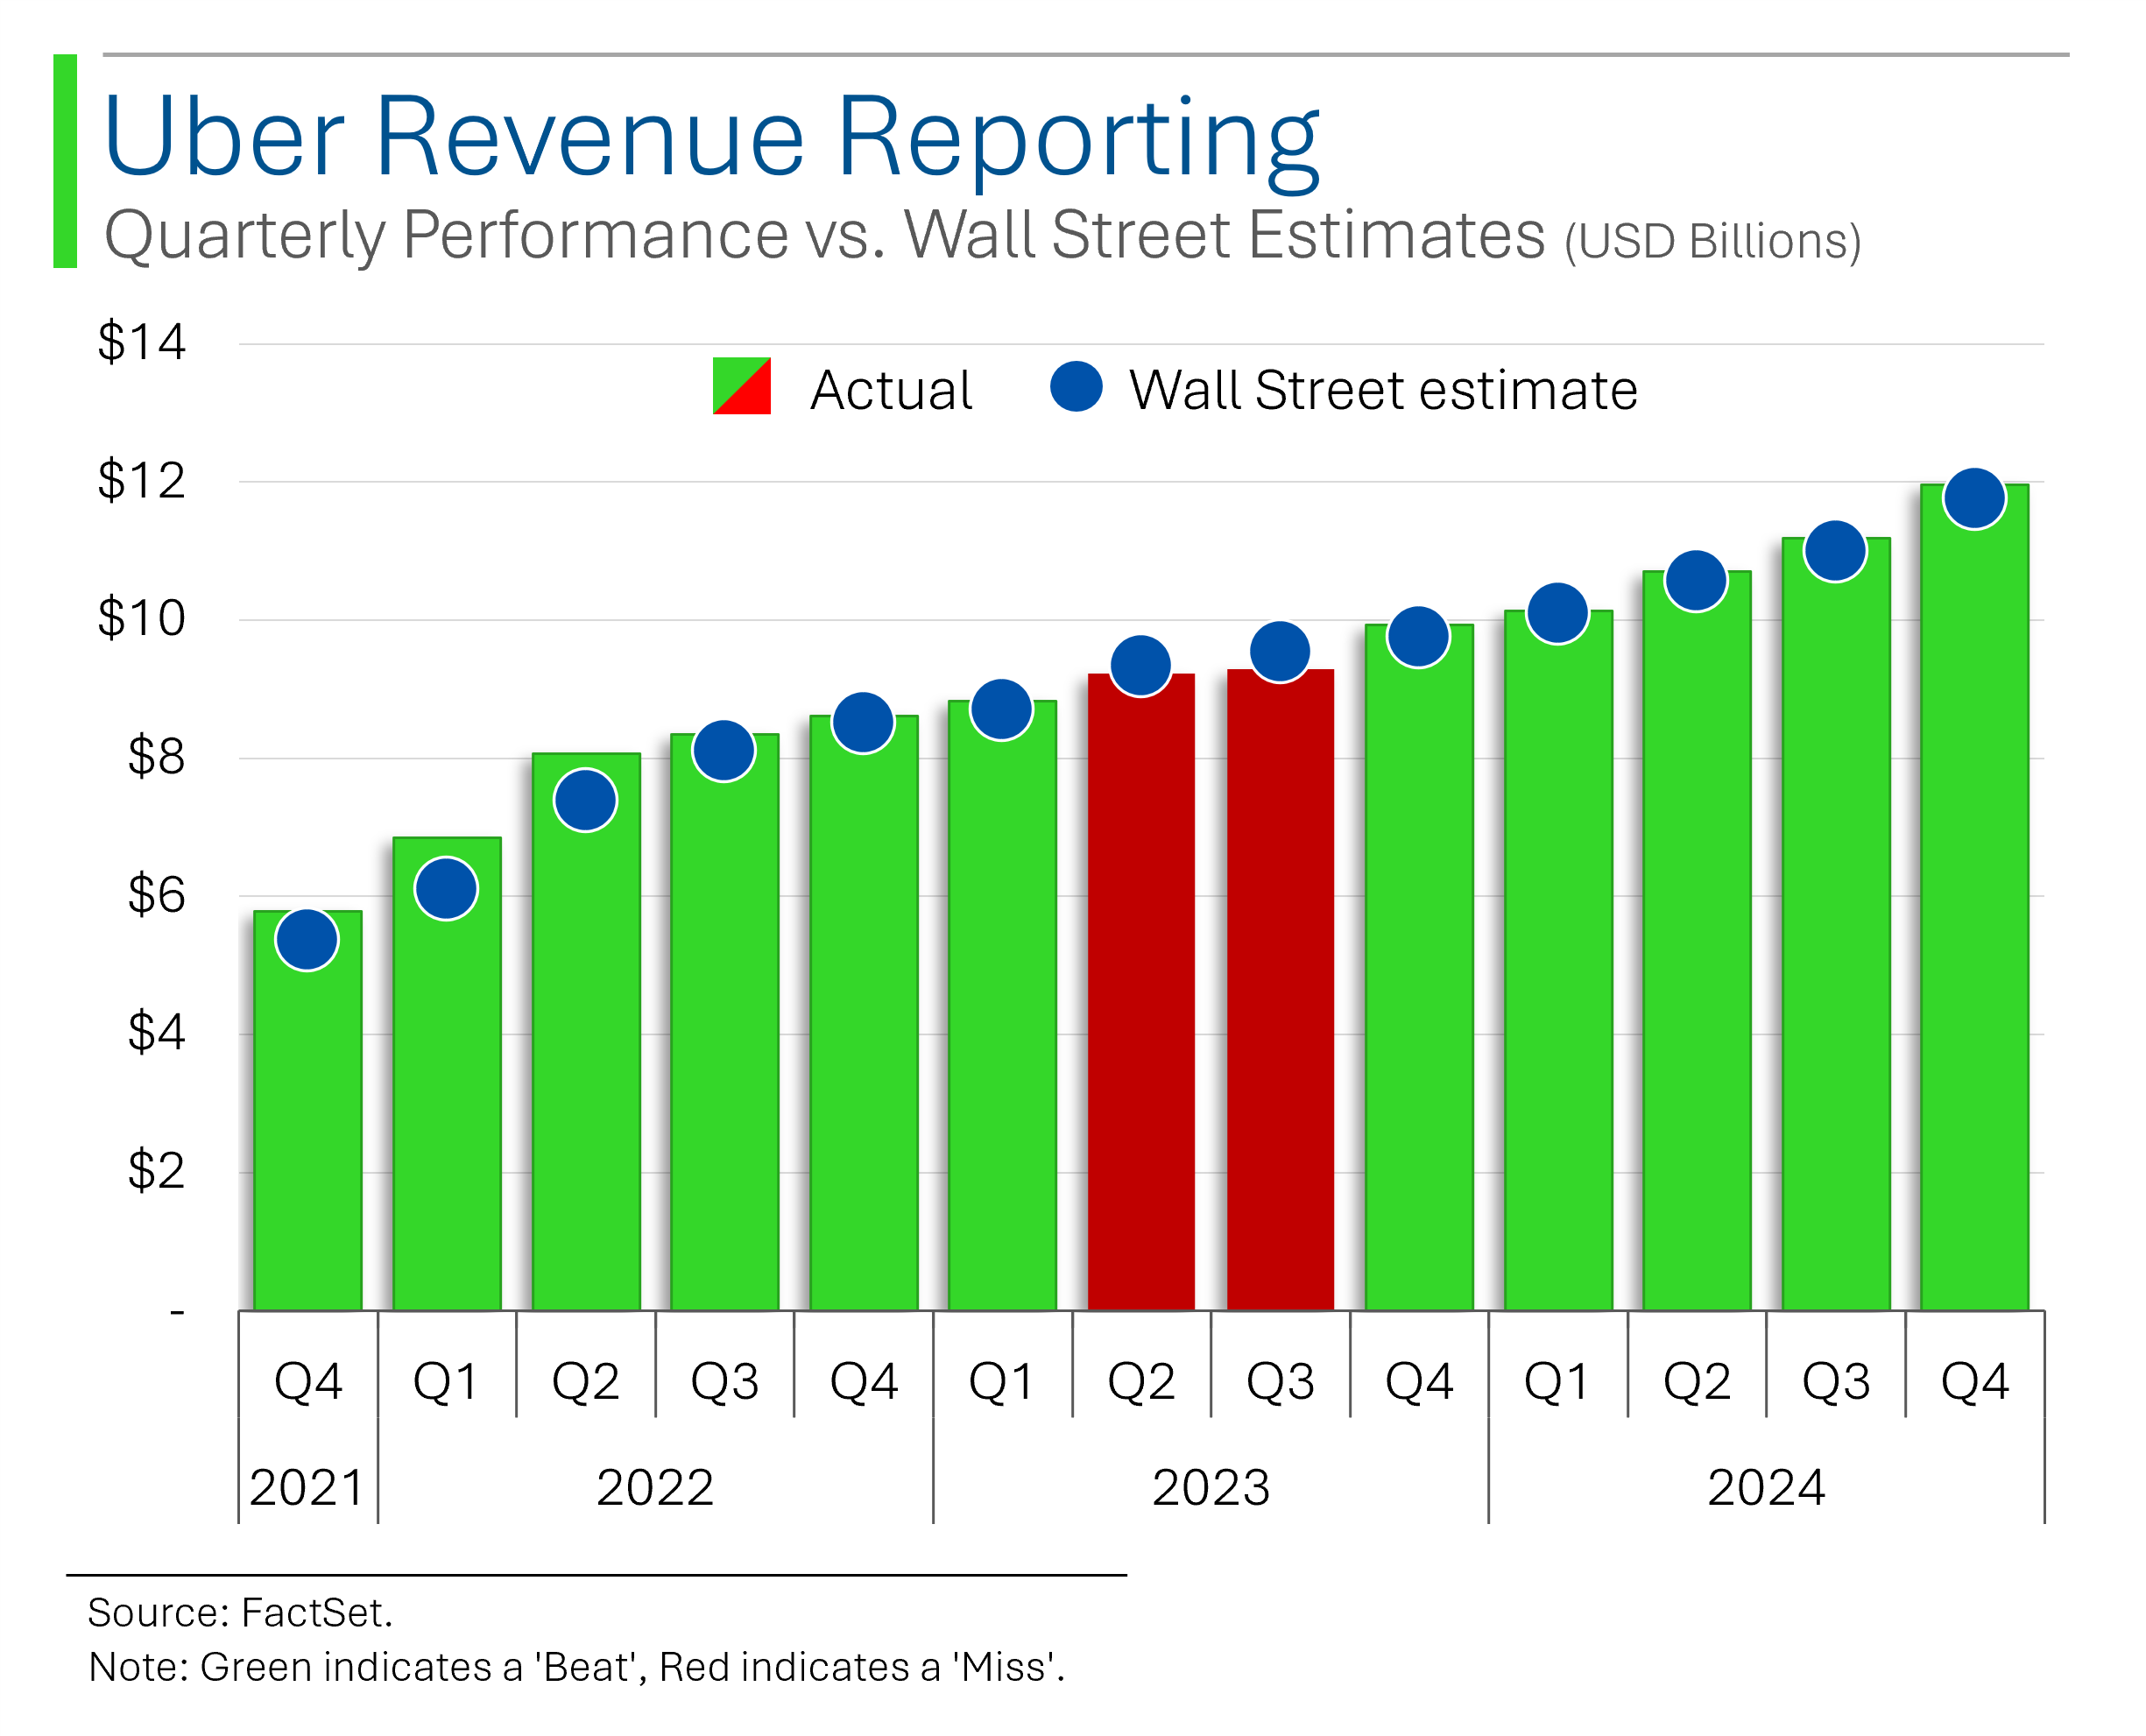
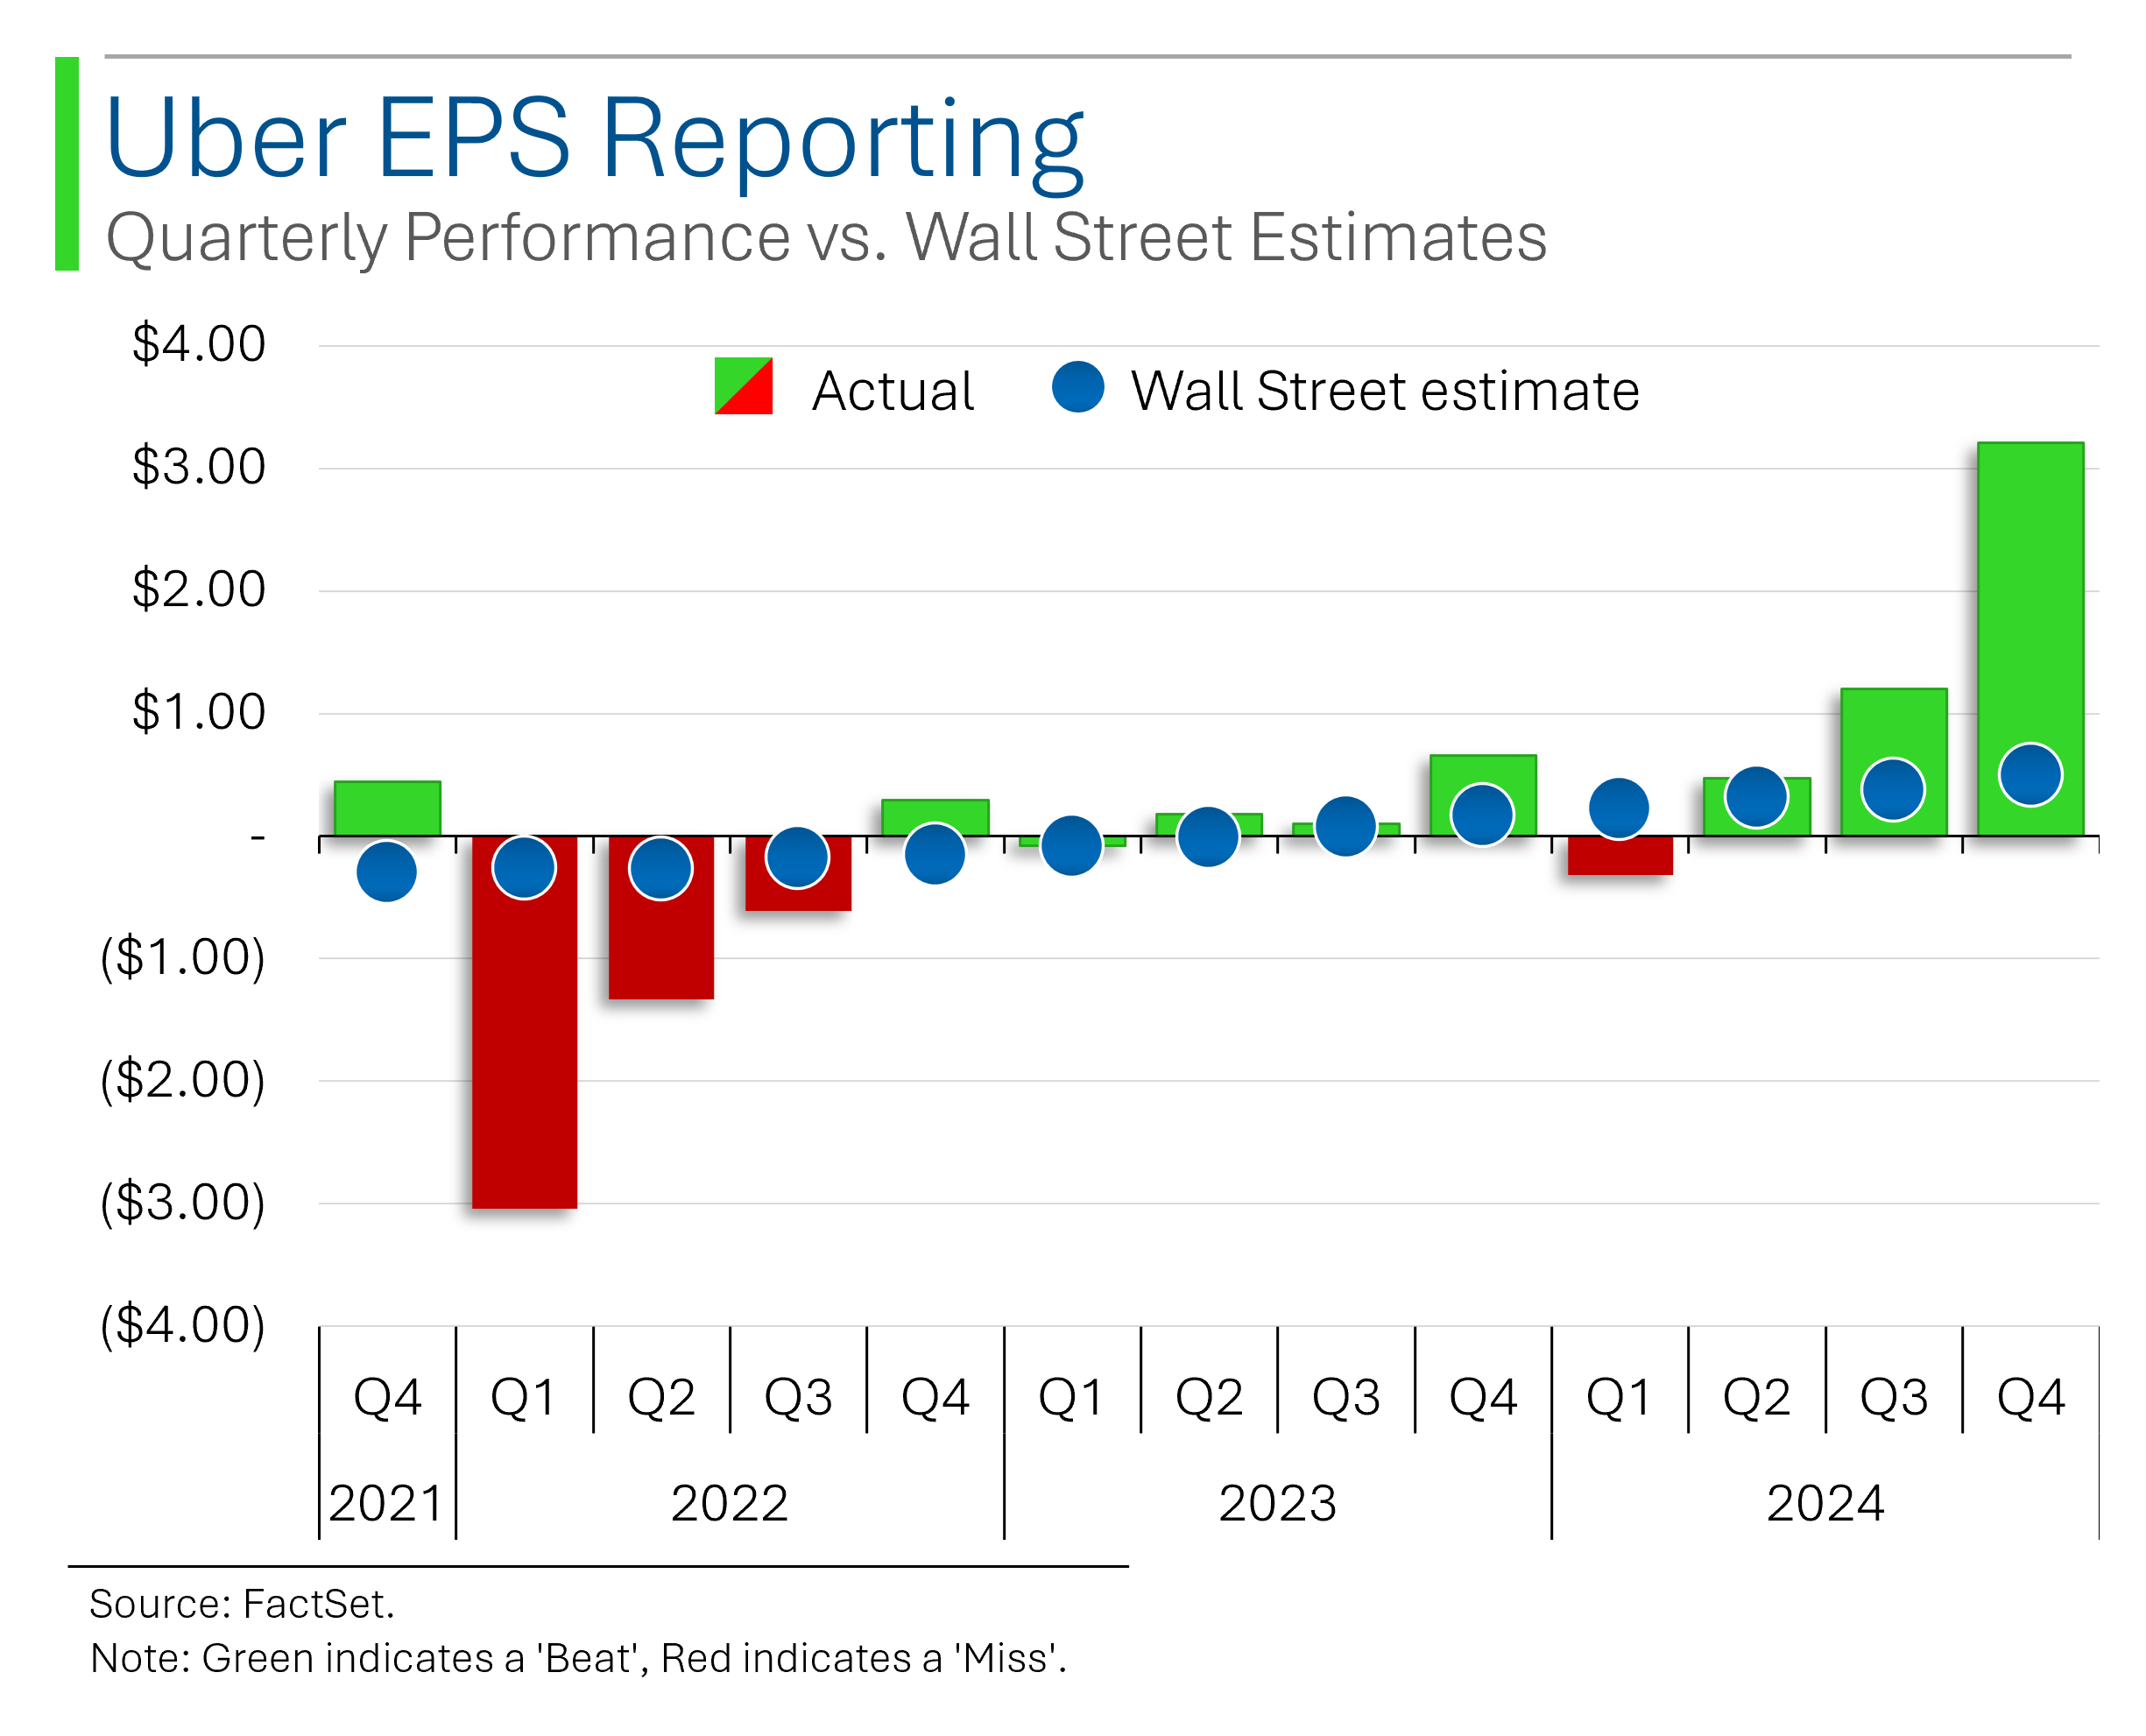
Speaking of stability, Uber’s earnings release last week ticked off yet another quarter of solid beats: 5 straight for Revenue and 8 out of the last 9 for EPS.
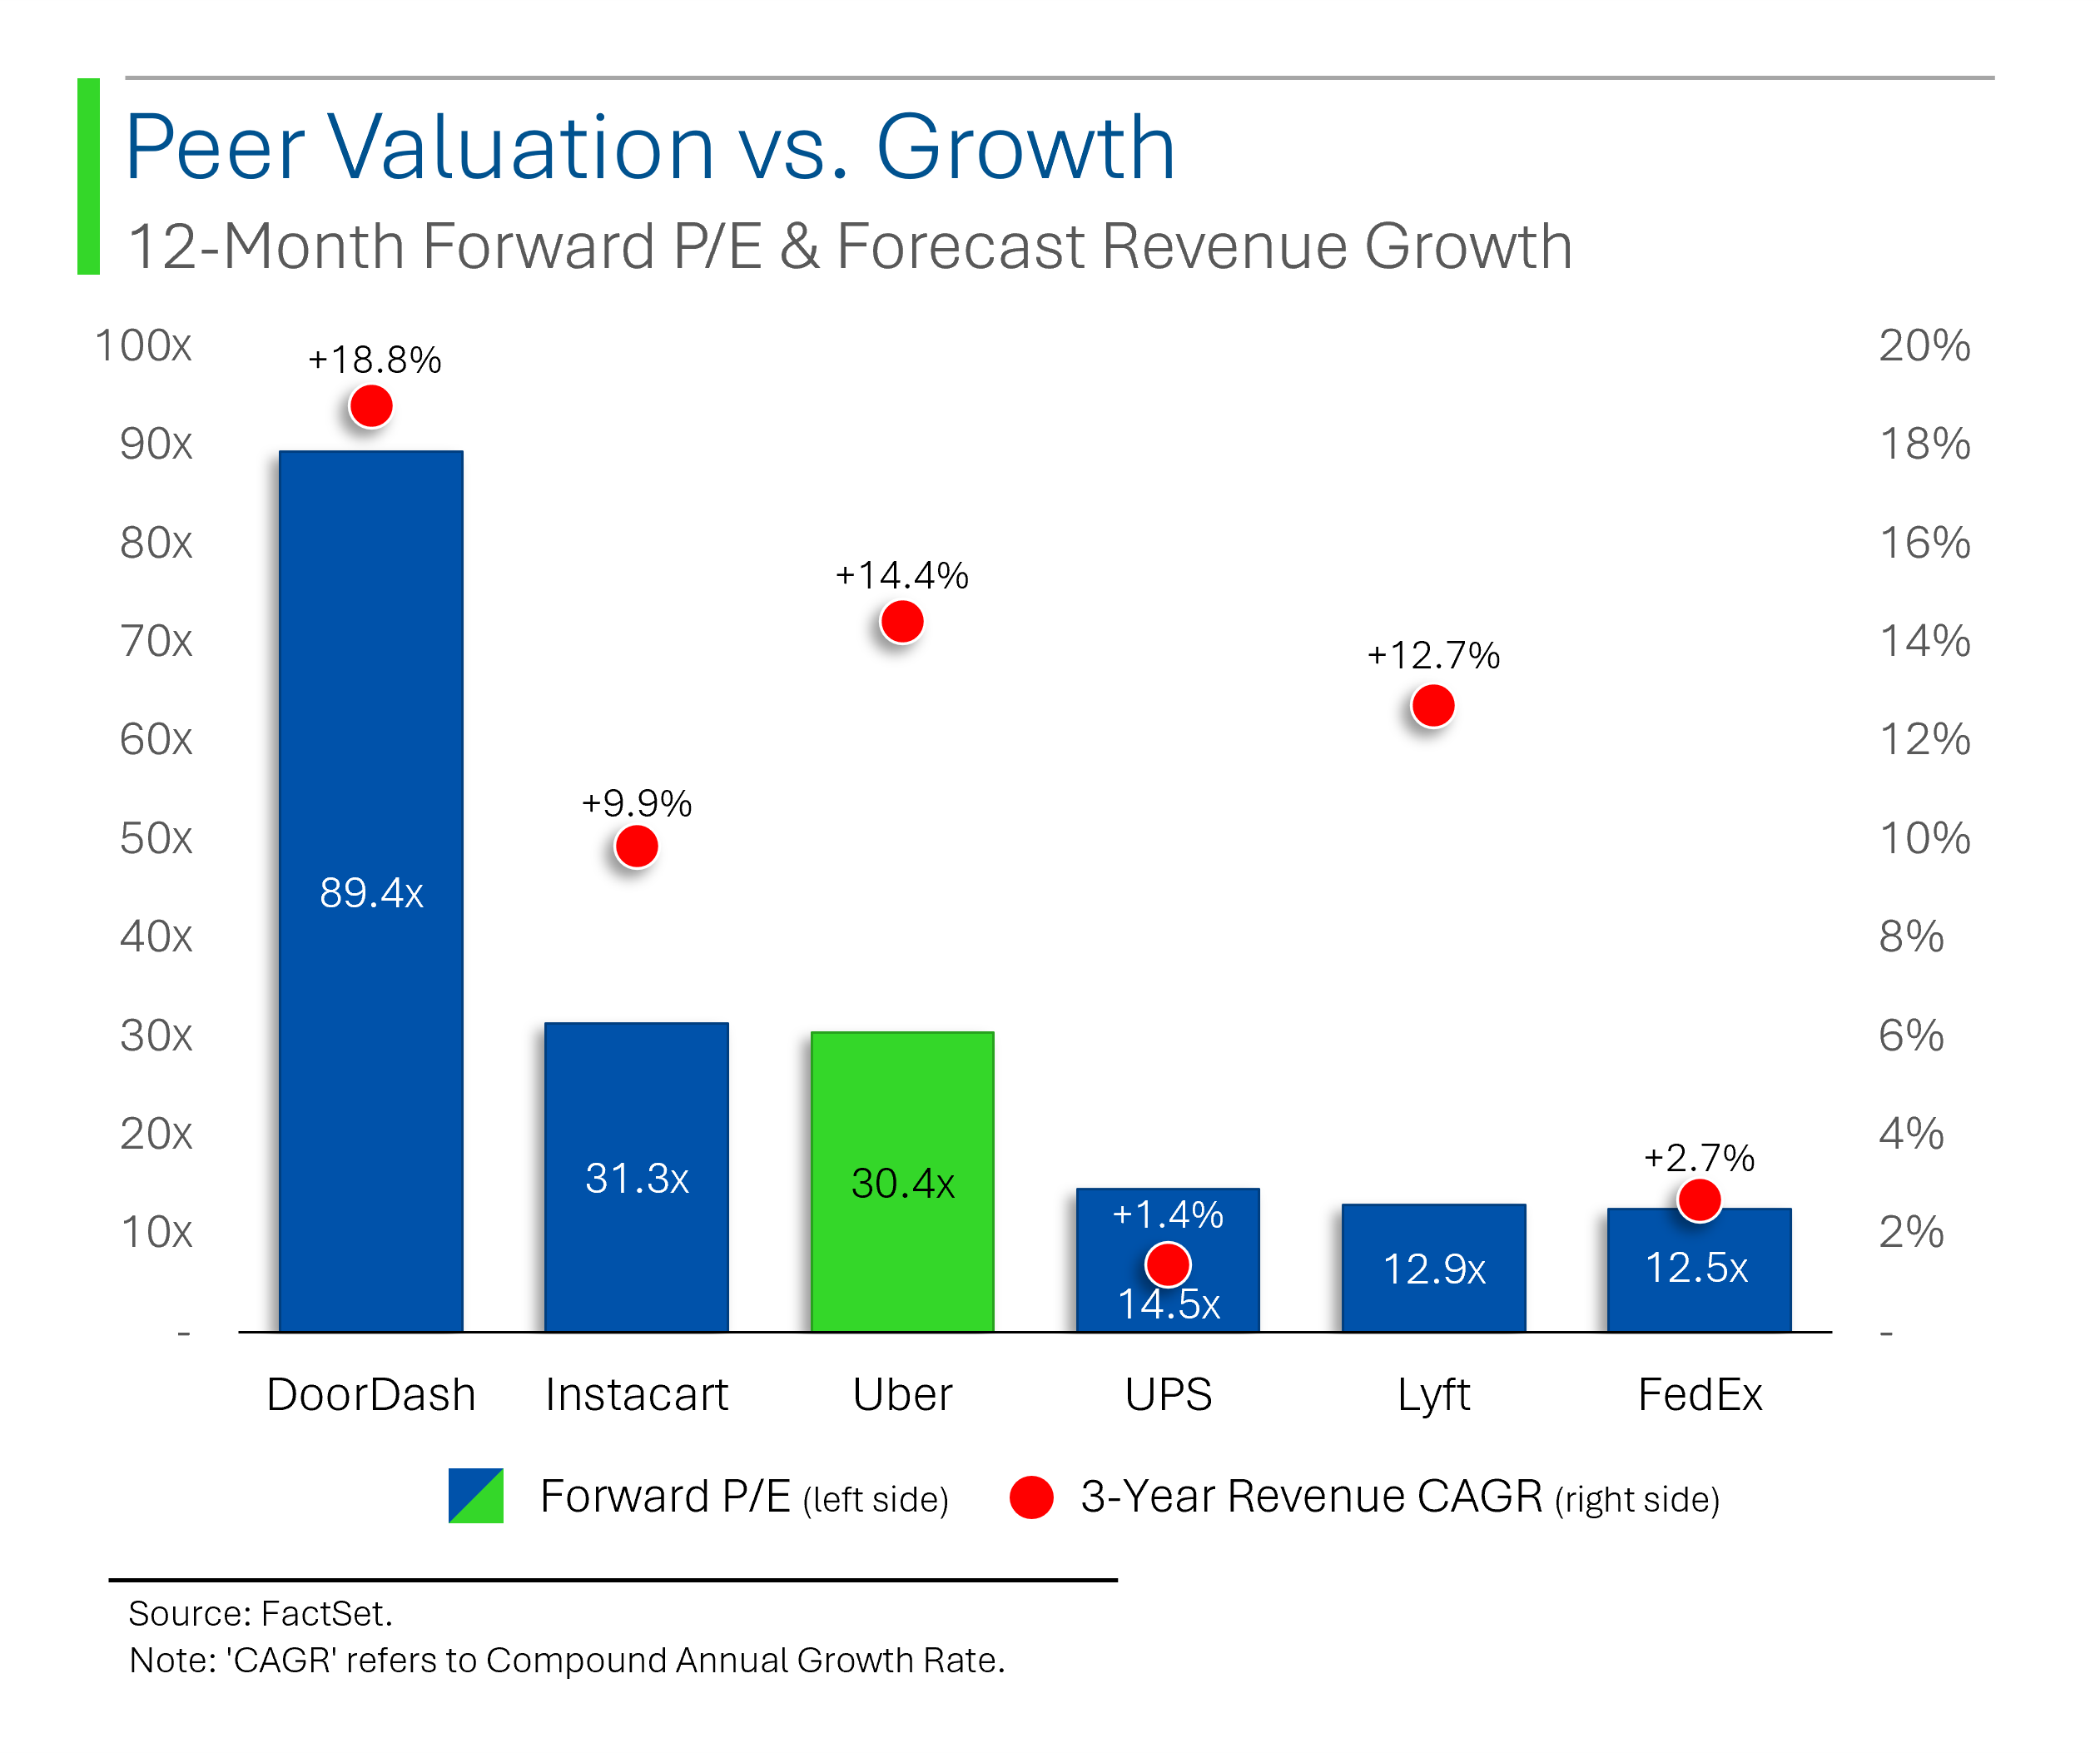
On the valuation front, Uber trades at a big premium to its legacy shipping peers like FedEx and UPS but is expected to grow significantly faster - potentially warranting the premium.
What stands out most is the fact that Lyft trades at such a steep discount to Uber despite expectations for a comparable amount of growth. There’s a lot of nuance to this, such as a much wider dispersion of Wall Street estimates for Lyft and more concern about long-term profitability, but I’m not sure that goes far enough to explain the spread (trading at 2.4x the multiple of your closest peer is pretty weird).
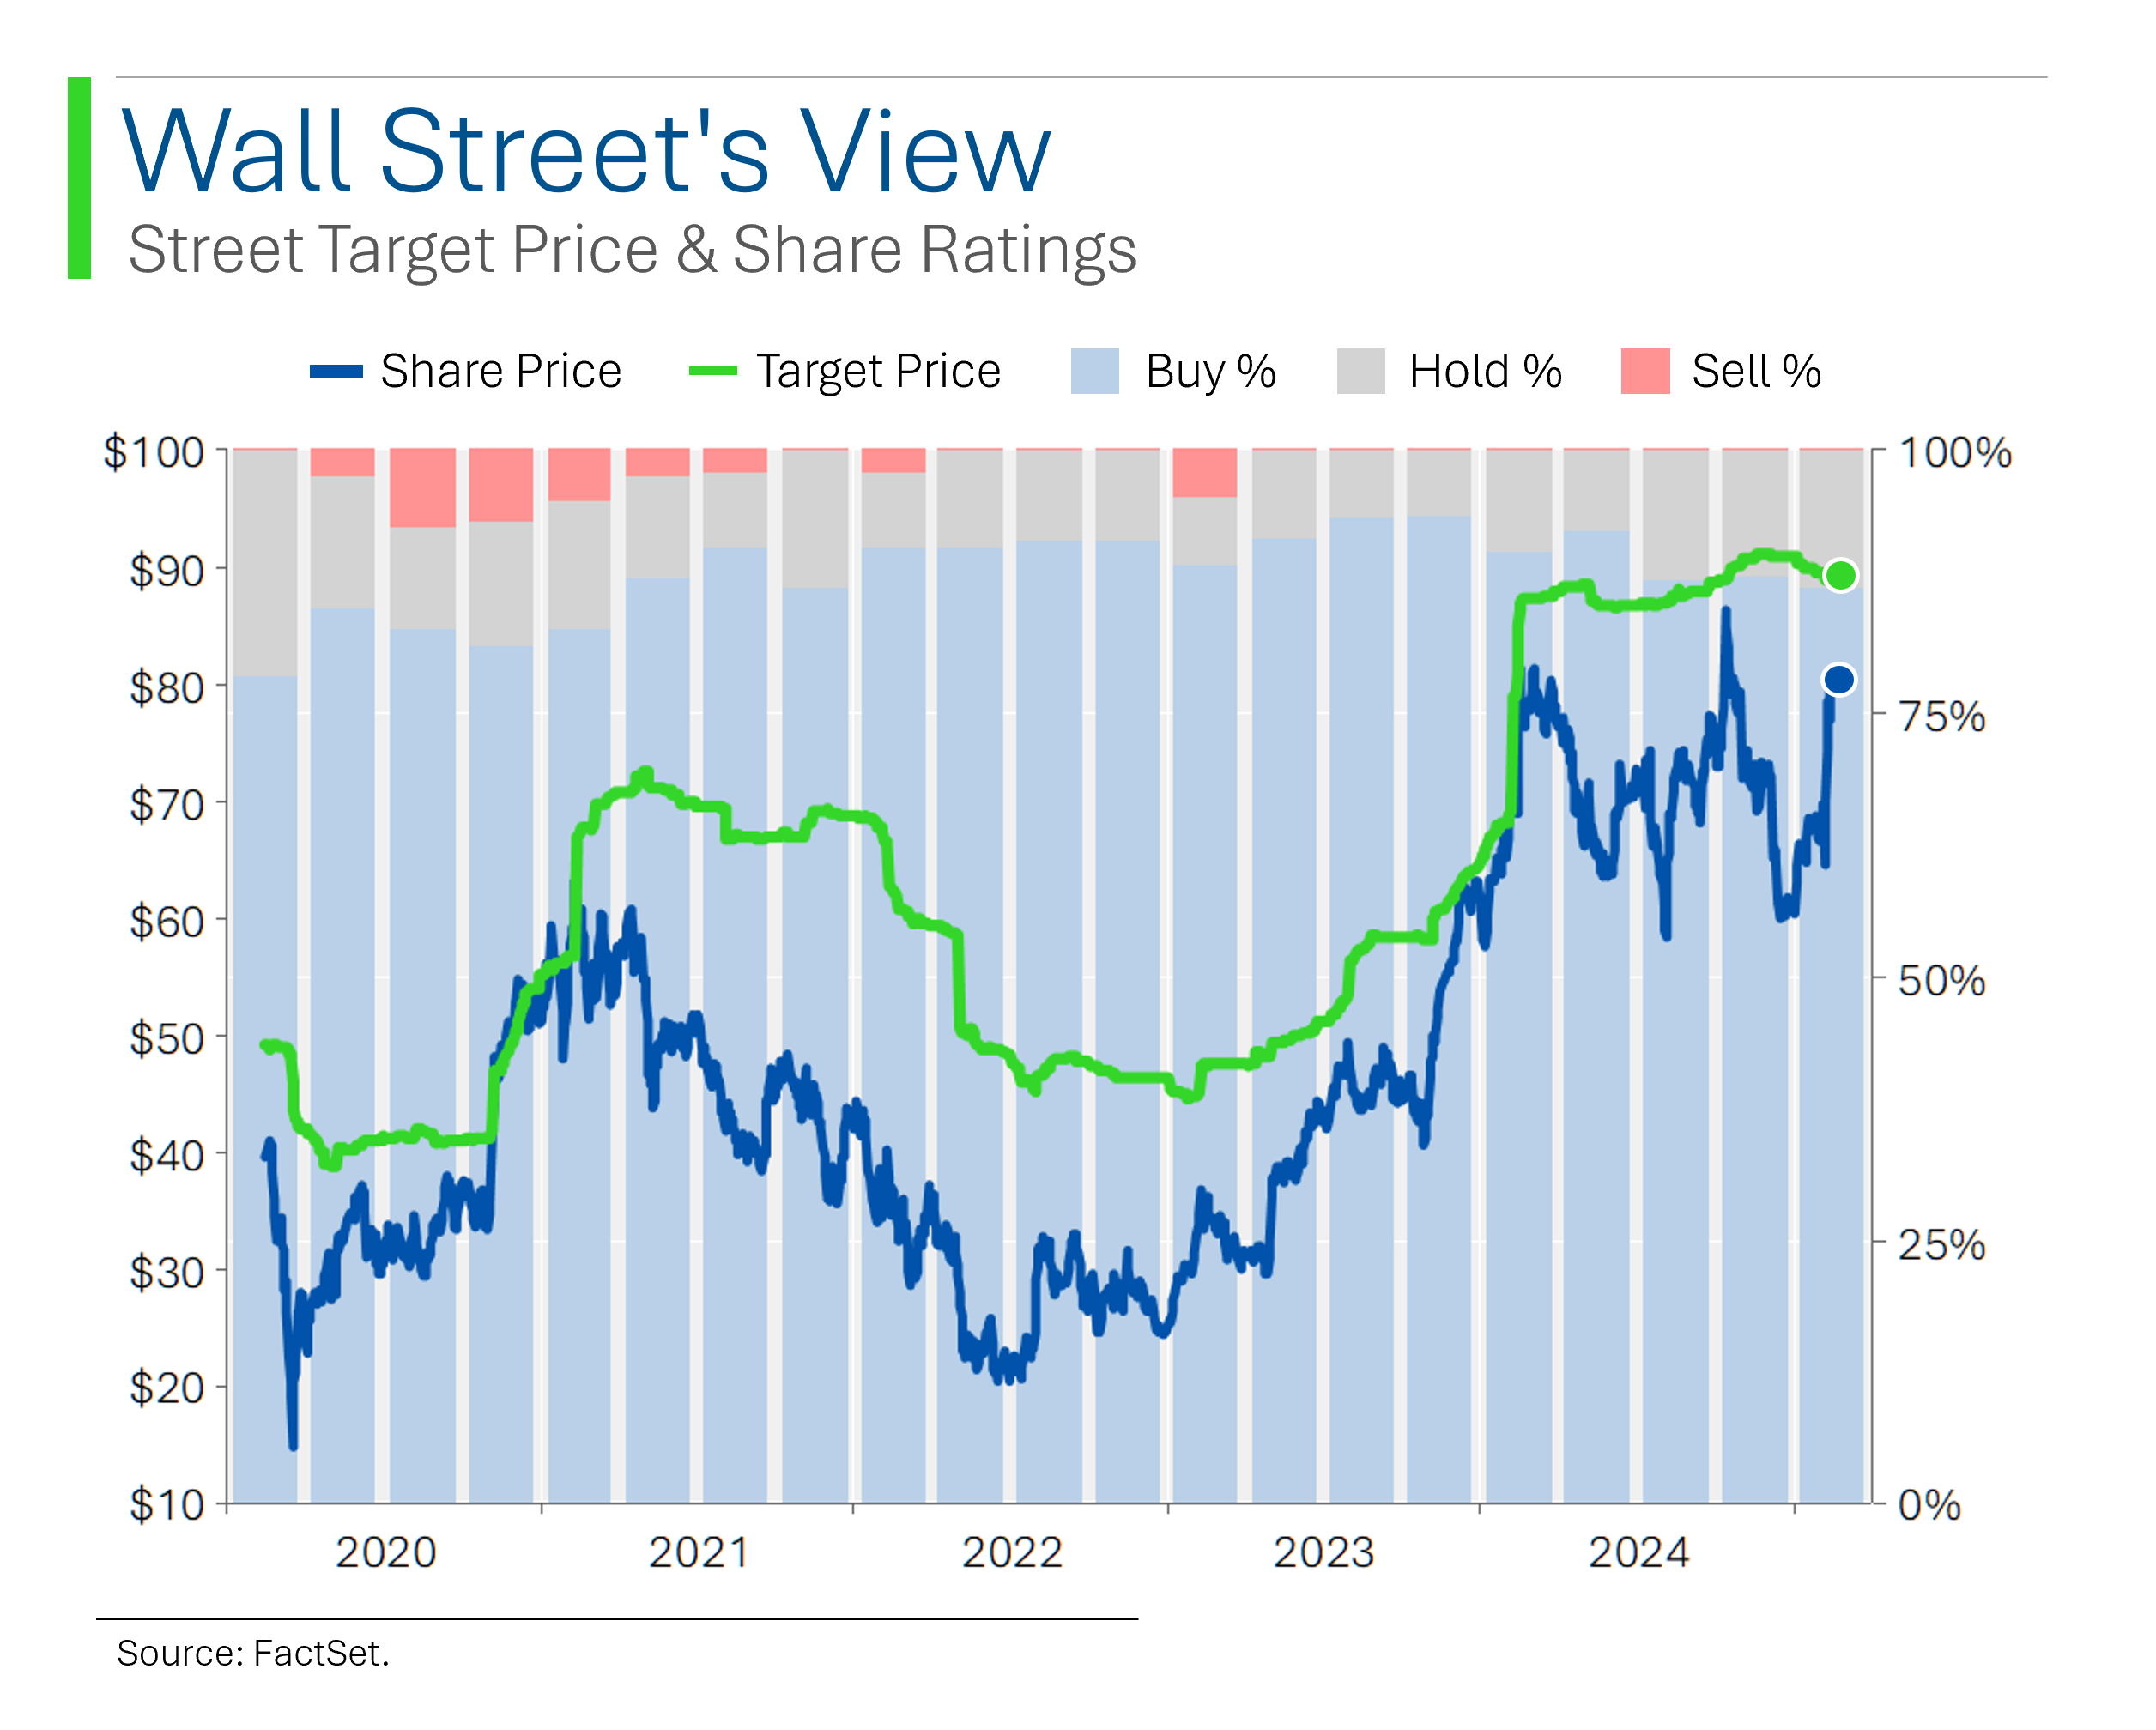
Wall Street has remained consistently positive on the shares throughout the company’s history. Presently, 87% of analysts hold a ‘Buy’ rating on the stock, while the average target price represents a 13% premium to the current market price.
While Uber still has a lot maturing to do, after shedding its ‘tech bro’ culture and posting two consecutive years of profitability, I think it’s pretty clear that the company is no longer a meme stock or pipe dream: It’s a legit, investible company.
The Signal & The Noise
An overly simplified - but still pretty useful - framework to look at the price change of stocks or the market as a whole is:
Share Price △ = (1+EPS △) x (1+P/E △) - 1
Basically, the change in the share price is a function of how much EPS has changed and how much the P/E changed.
For example, if EPS grew 5% and the P/E multiple went from 20x to 22x (+10%), then the share price went up 15.5%1
1. Price Change = (1 + 5%) x (1+ 10%) -1.
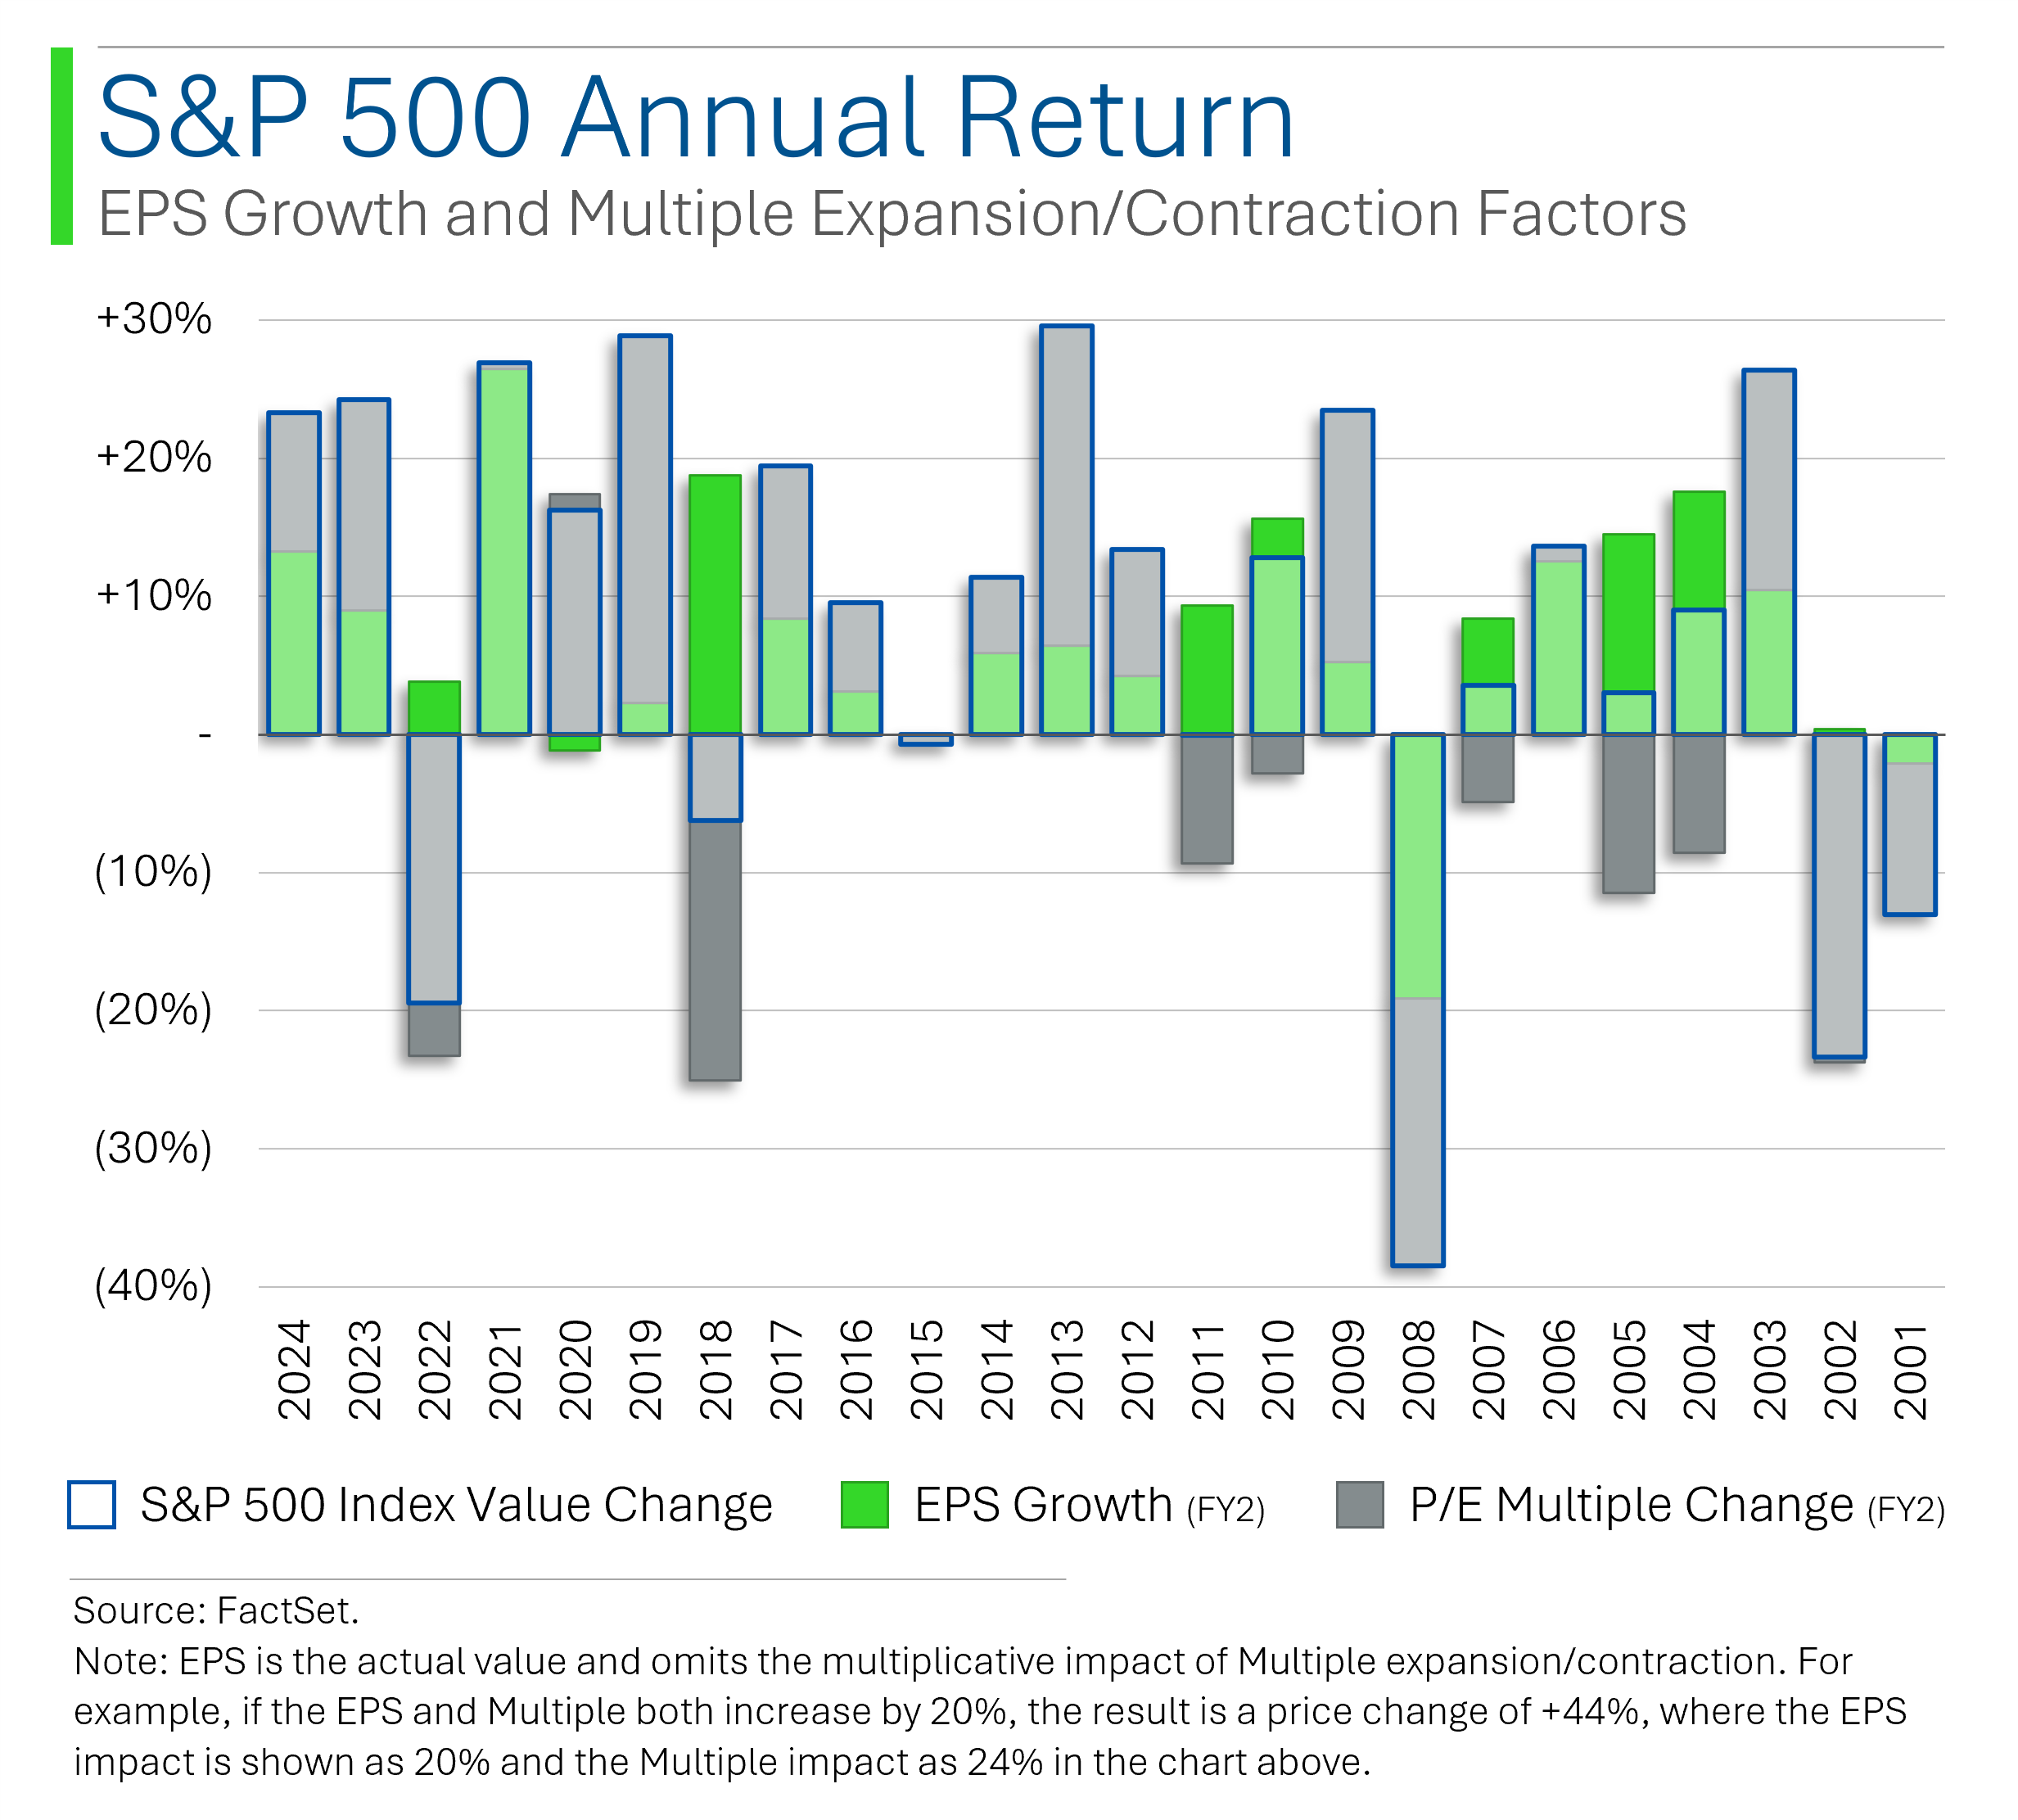
Above I compiled this information for the S&P 500 using the rolling change in two year forward EPS estimates. If you look at the return of the S&P 500 in this way since 2001, two things really stand out:
1. EPS change is usually positive; Multiple change is a crapshoot
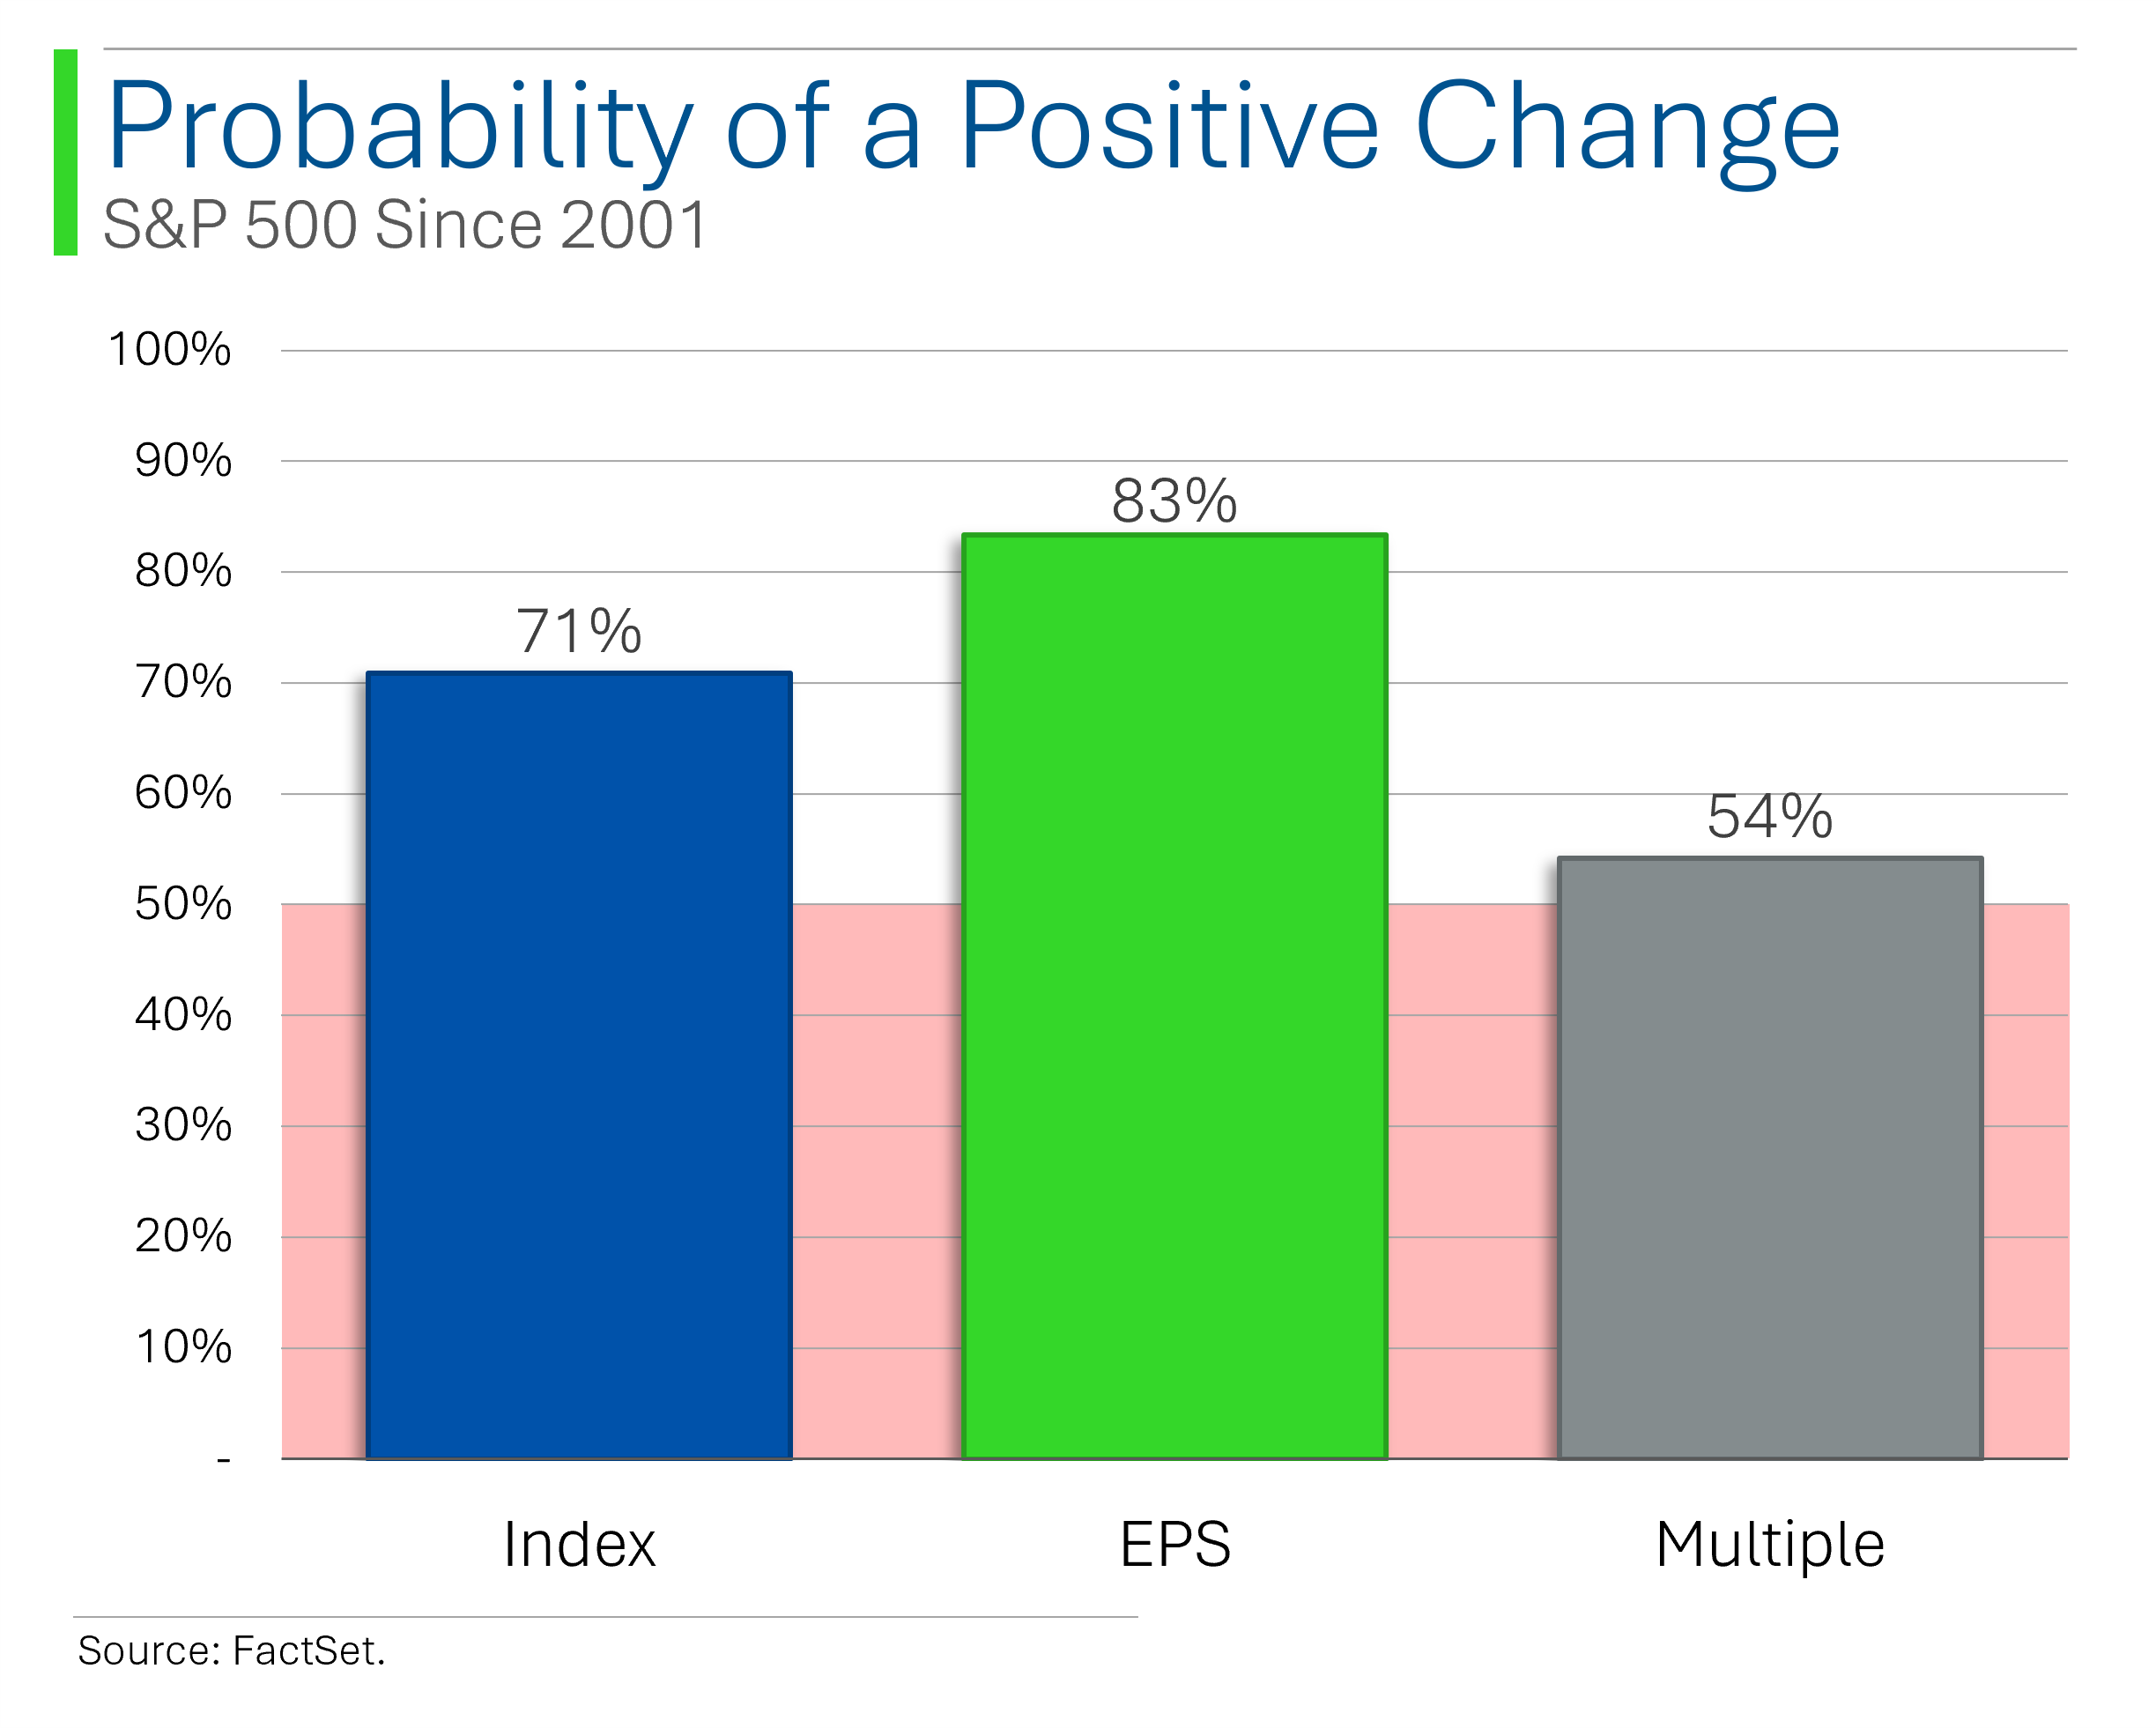
The S&P 500 has been up 71% of the time, while EPS growth has been positive a massive 83% of the time. Strong stuff.
However, the change in the multiple has only been barely positive at 54%. This makes sense if you believe that over the long-term the multiple should bounce around based on fear/greed, as well as for reasons beyond just the change in EPS two years out (longer term issues, etc.), but generally stay at the same level.
Ryan’s Takeaway: Betting on stocks getting cheaper or more dear is hit or miss, but growth (in this case using EPS to illustrate the point) is really the clearest determinant in price performance.
This is essentially why I’d classify myself as a growth investor.
2. The Change in EPS usually dictates price performance
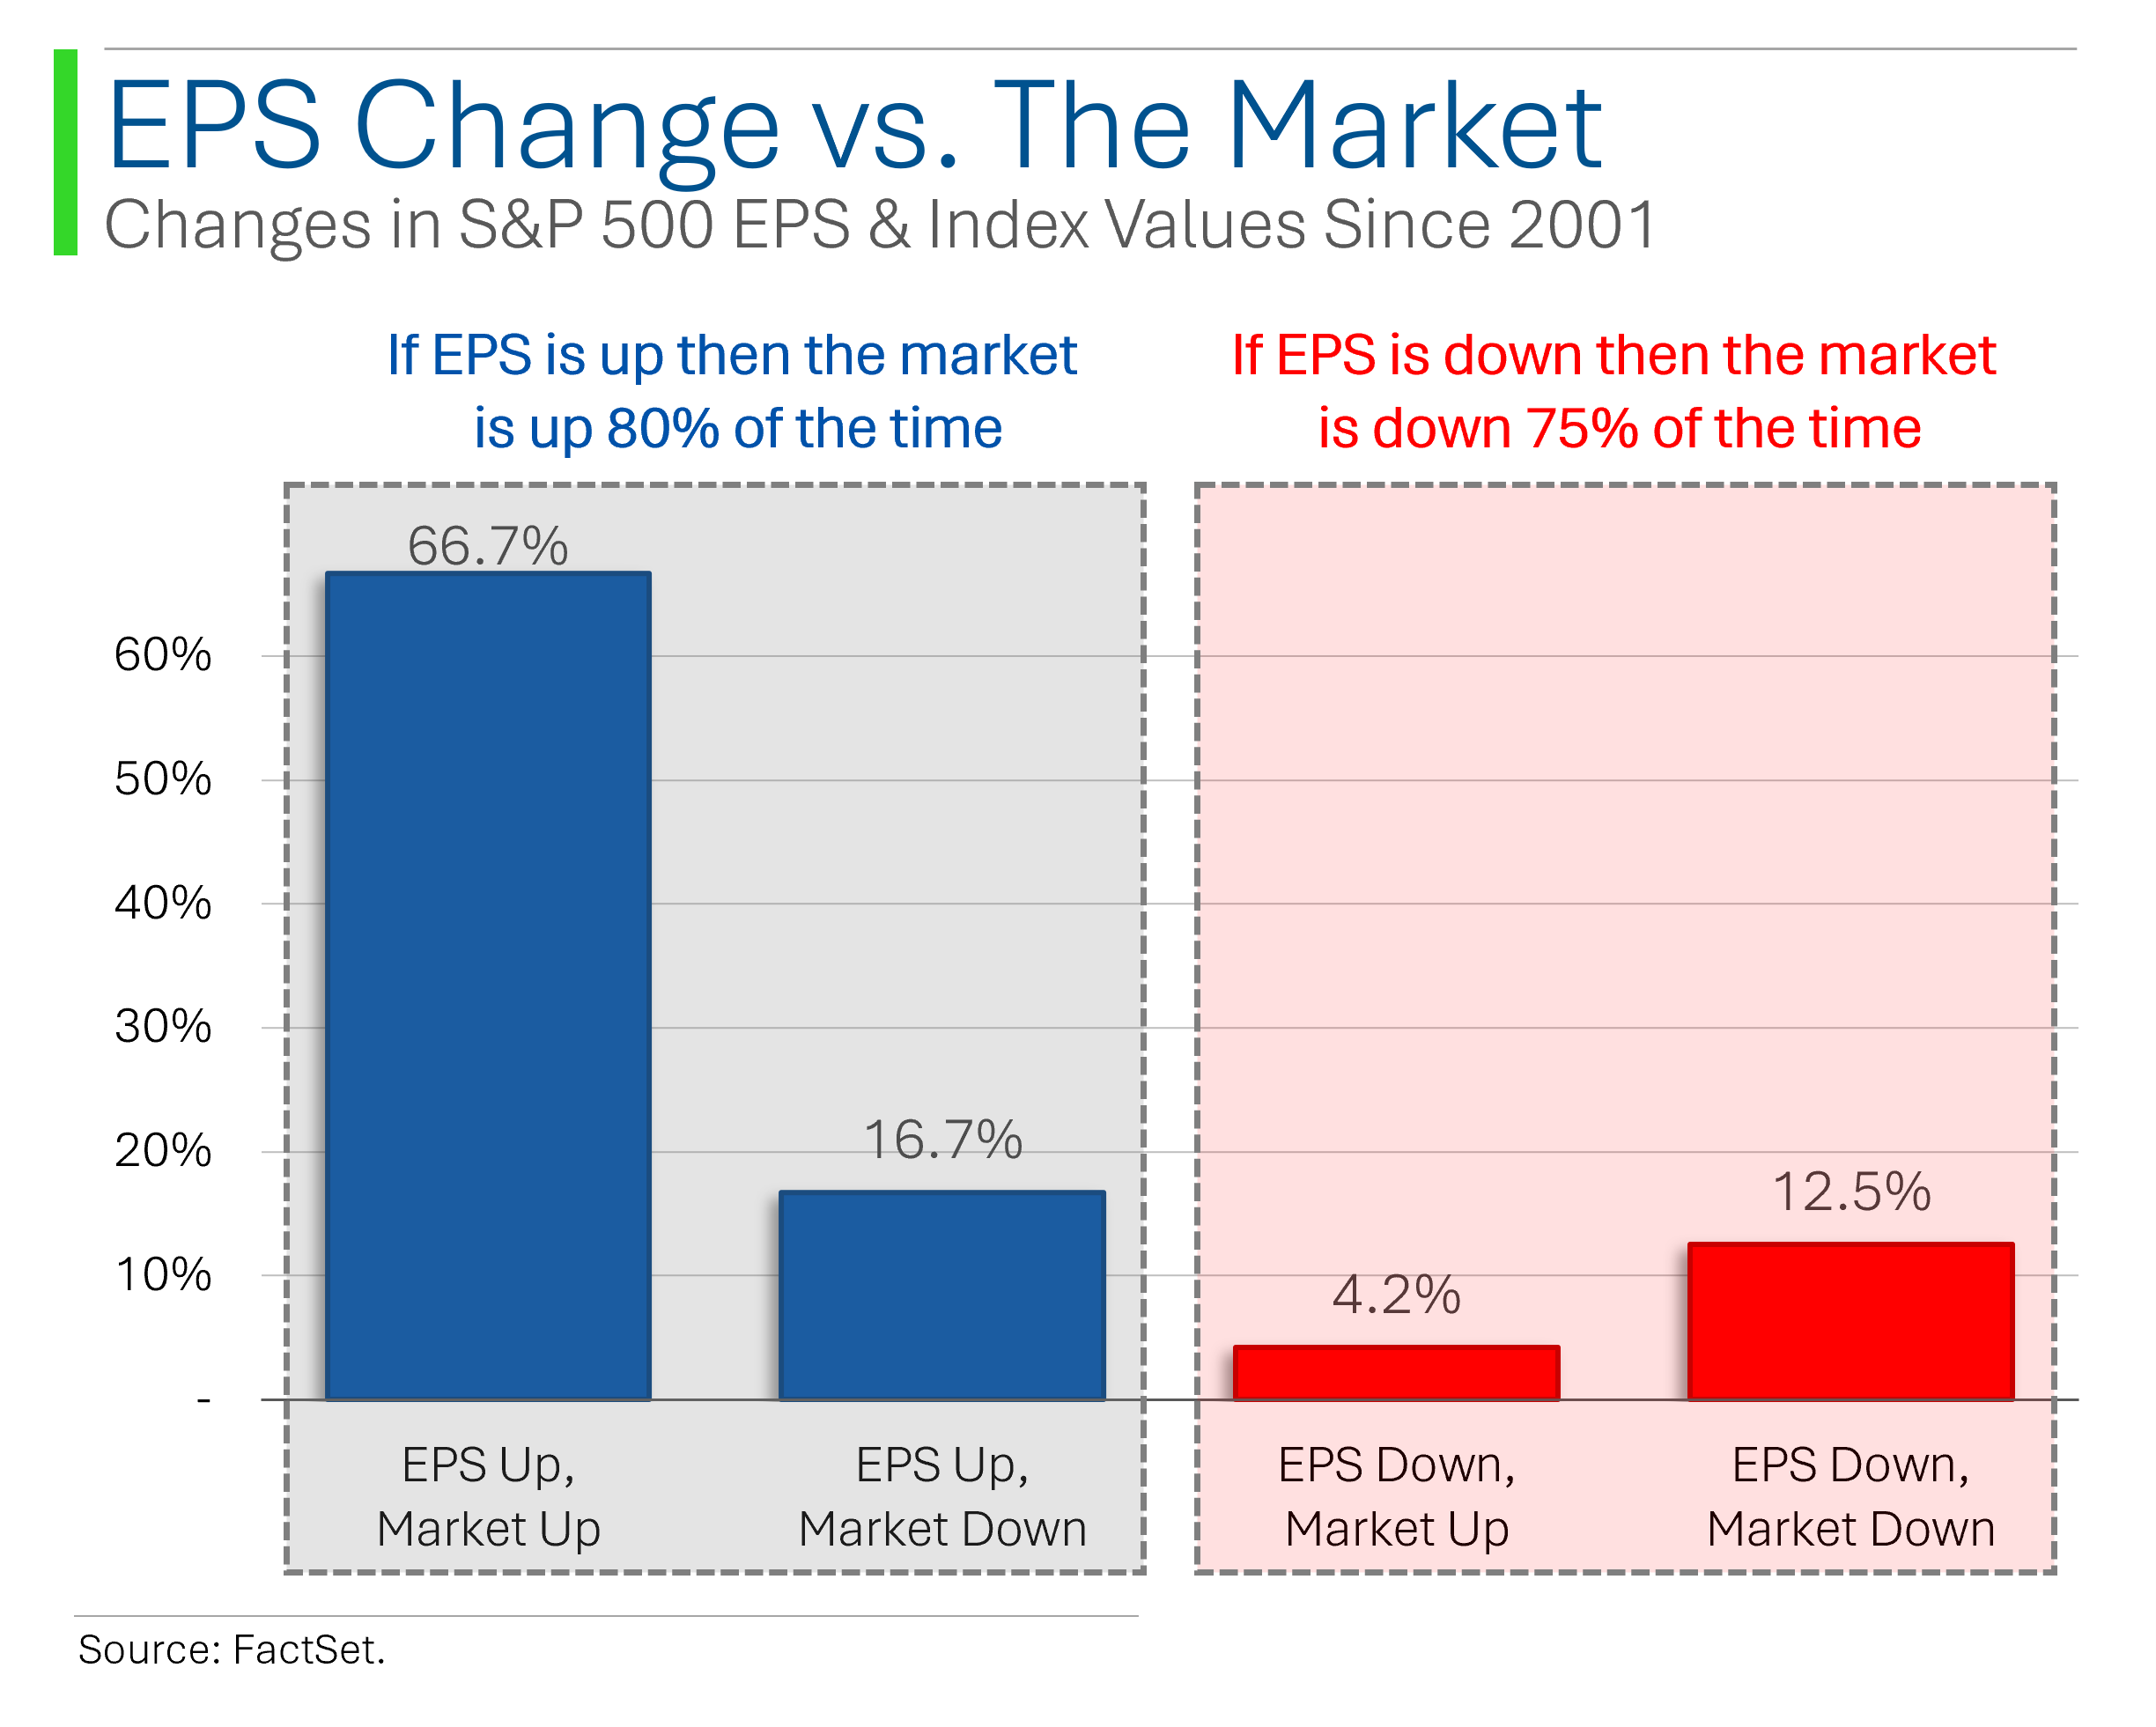
Since 2001, if EPS growth has been positive then the market is up 80% of the time. However, if EPS growth is negative then the market is down 75% of the time. In fact, since 2001 the market has only gone up when EPS growth was negative once: In 2020 during the ‘Everything Bubble’. Not exactly a typical year for markets…
Ryan’s Takeaway: I’m using EPS as a proxy here for the health and growth prospects of a business/market, while obviously there are more factors at play.
That said, if earnings are growing then the business/market is generally worth more. Whether or not that is realized over the course of the year, however, is subject to a bit of randomness but it has a pretty high hit rate.
To wrap this up, using P/E multiples and forecast EPS doesn’t exactly capture the true health of a business. Real intrinsic value - to the extent that that’s even a real thing - is a confluence of a million details and data points.
I use EPS and P/E in the same way you could use EBITDA and EV/EBITDA, or something entirely else like Free Cash Flow. The essence is that they are proxies for ‘how much is this business growing’ and ‘how much is that growth worth’.
And, generally speaking, better growth = better returns. The rest is basically noise.

Joke Of The Day
“The trick is to stop thinking of it as ‘your’ money.” – IRS auditor

Trivia
Today’s trivia is on Uber.
What year was Uber founded?
A) 2007
B) 2009
C) 2011
D) 2013In which country was Uber forced to sell its operations to a local competitor in exchange for a stake in the company?
A) China (sold to Didi Chuxing)
B) India (sold to Ola)
C) Russia (sold to Yandex)
D) Brazil (sold to 99)What major company did Uber acquire in 2020 for its food delivery business?
A) Instacart
B) Postmates
C) DoorDash
D) DeliverooUber once tried expanding into which of the following industries but later abandoned the effort?
A) Self-driving car manufacturing
B) Airline services
C) Electric scooter production
D) Freight shippingWhat was Uber’s valuation at the time of its IPO?
A) $82 billion
B) $100 billion
C) $60 billion
D) $50 billion
(answers at bottom)
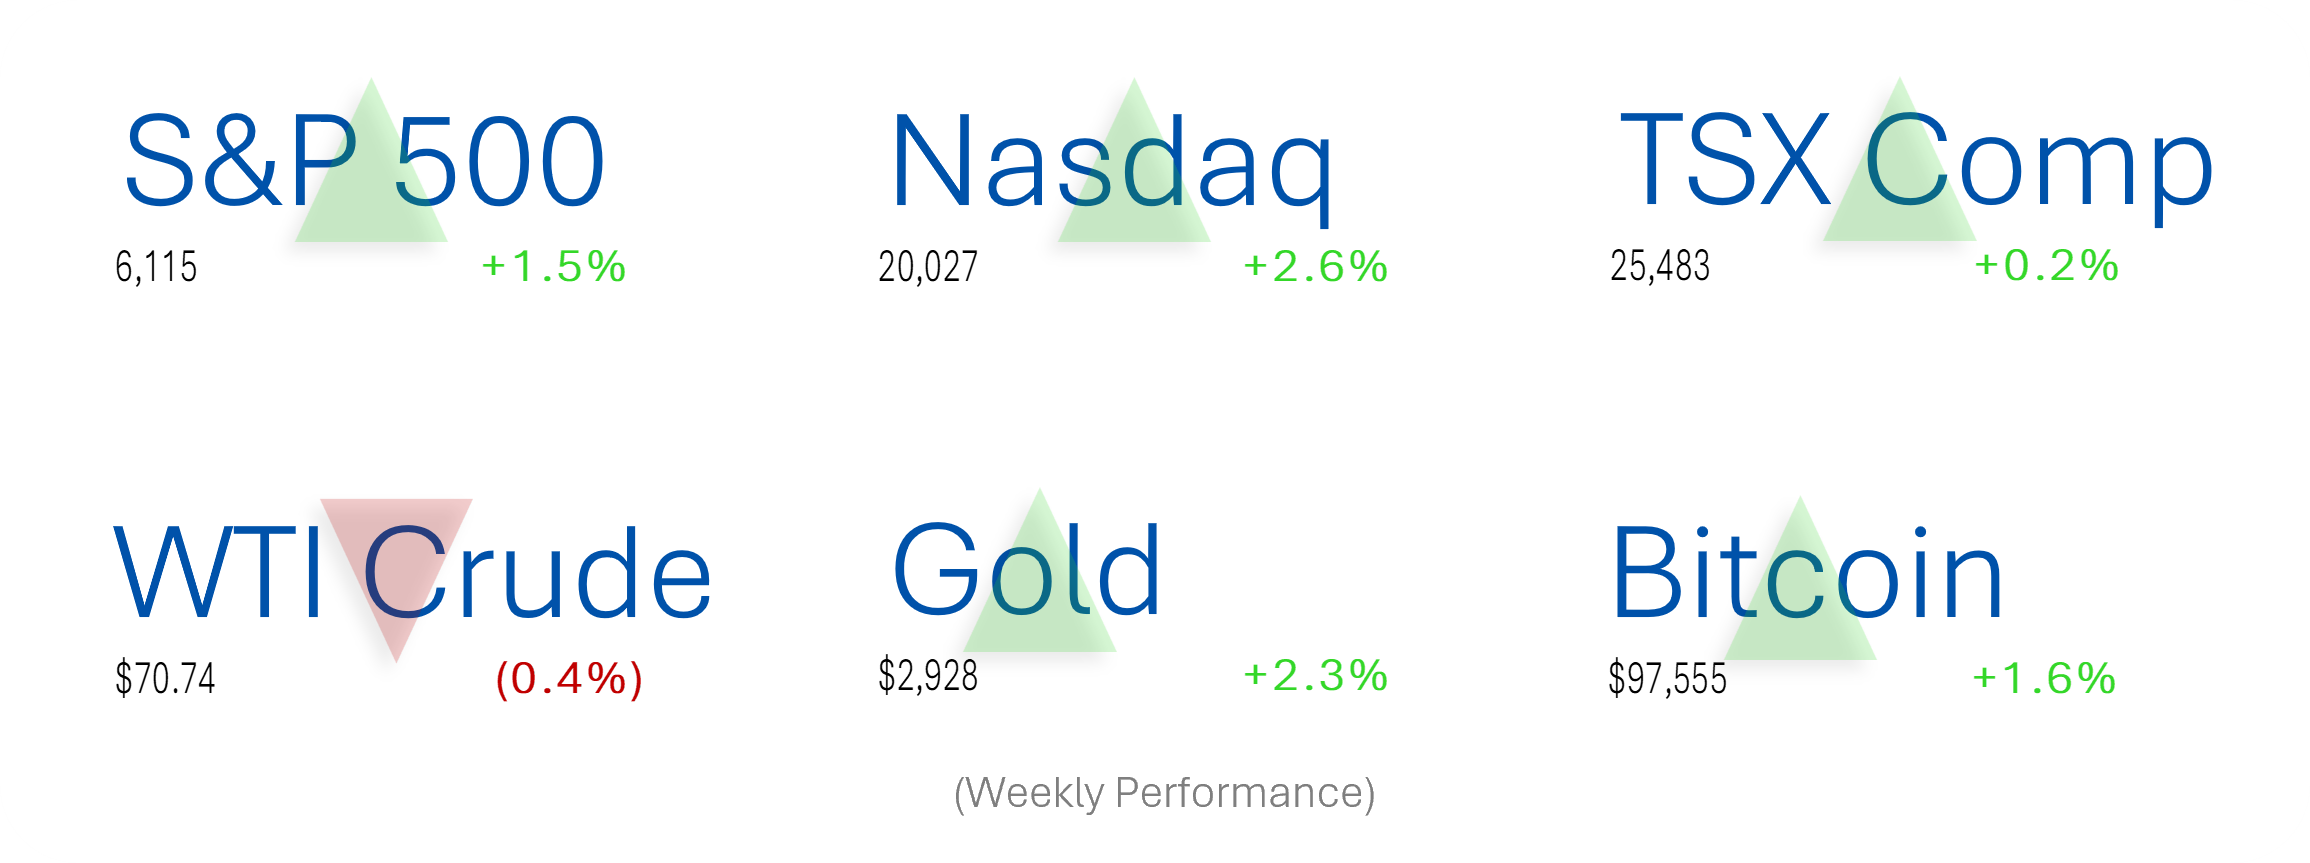
Market Update
Please consider giving this post a Like, it really helps get Substack to share my work with others.

Trivia Answers
B) Uber was founded in 2009.
A) Uber was forced to exit China (sold to Didi Chuxing).
B) Uber bought Postmates in 2020.
A) Uber tried it’s hand at self-driving car manufacturing but eventually bailed on that idea.
A) At their IPO Uber was worth $82 billion.
Thank you for reading StreetSmarts. We’re just starting out so it would be great if you could share StreetSmarts with a friend that might be interested.
Nick Colas on the compound said look at what earnings grow and then look at the price. Very high correlation of stock price performance and earnings growth! Thanks for sharing! As always really enjoy your take!
Really enjoyed this!