

A Simplified Model For Valuing Companies
(Downloadable Spreadsheet Included)

“We end up spending money we don't have, to buy things we don't need, to impress people we don't like"
- Will Rogers
"I'm not broke. I'm just temporarily unsuccessful."
- Joey Tribbiani (Friends)

Hey Readers!
Thanks for tuning in this week. I’m looking for a new company/sector to do a deep-dive on for next week. If you have any ideas (ideally a company I’ve heard of and isn’t a pump-and-dump) please let me know in the comments below!
Hope you have a relaxing weekend as earnings season kicks off in earnest next week, including reports from five of the Mag7.
Have a good weekend,
- Ryan

Street Stories
A Simplified Model For Valuing Companies
Picking stocks is fun. And very popular.
However, actually diving into companies and putting in the work to determine if a stock is a good investment can take a lot of time. In my past hedge fund and mutual fund days, it wasn’t uncommon for me to spend upwards of a month ramping up on a company - too frequently to determine it wasn’t a good investment at the one yard line.
Retail investors (~90% of my readership) don’t have that kind of time on their hands, and so I find they fall into one of two categories:
People who just skip all the analysis, Excel modelling mumbo-jumbo (‘inch deep, mile wide’)
People who do it but only end up looking at a handful of companies (‘mile deep, inch wide’)
So, I thought I’d walk through a simplified framework to quickly analyze companies (1-1.5hrs) so you can see more investment opportunities and have a better sense of return potential. The link for my framework can be found below!
Before I go any further, I should state that this isn’t a panacea. If you build a simple model on a company and are considering investing in it, by all means put in the additional work to build up your confidence. This is my way to get 80% of the way there in the shortest time possible; that way I can look at a lot more companies and figure out which ones deserve a deeper look.
Let’s get into it!


As you can see above, there are two steps to this framework: 1) Building a simple Income Statement model; and 2) Estimating the future share price and potential investment return based on the model’s outputs using a Price to Earnings multiple.
I’ve attached this model in case you want to check it out/modify it for your own analysis: Model Link

Step 1: Building An Income Statement Model
Pt. I - Getting the Data

To build this style of Income Statement model you typically only need data from two sources:
The audited Income Statement published under the Generally Accepted Accounting Standards (‘GAAP’). (I recommend using annual figures to start as they are easier to model and can give a longer time frame of historical information for the same amount of labor)
The adjustments made by the company that they use to calculate their ‘Non-GAAP’ Earnings Per Share. (The fact that some adjustments made by companies are silly or manipulative and should be ignored is beyond the scope of this post)
This information is easy to find by simply doing a google search for ‘[company name] investor relations’. While there is some variation in how companies present this information, finding the two pieces of information you need isn’t generally an issue.
To increase the accuracy of your model, it’s often helpful to add granularity to your estimates for Revenue and Gross Margin. For example, a model for Tesla might include their published production figures by vehicle.
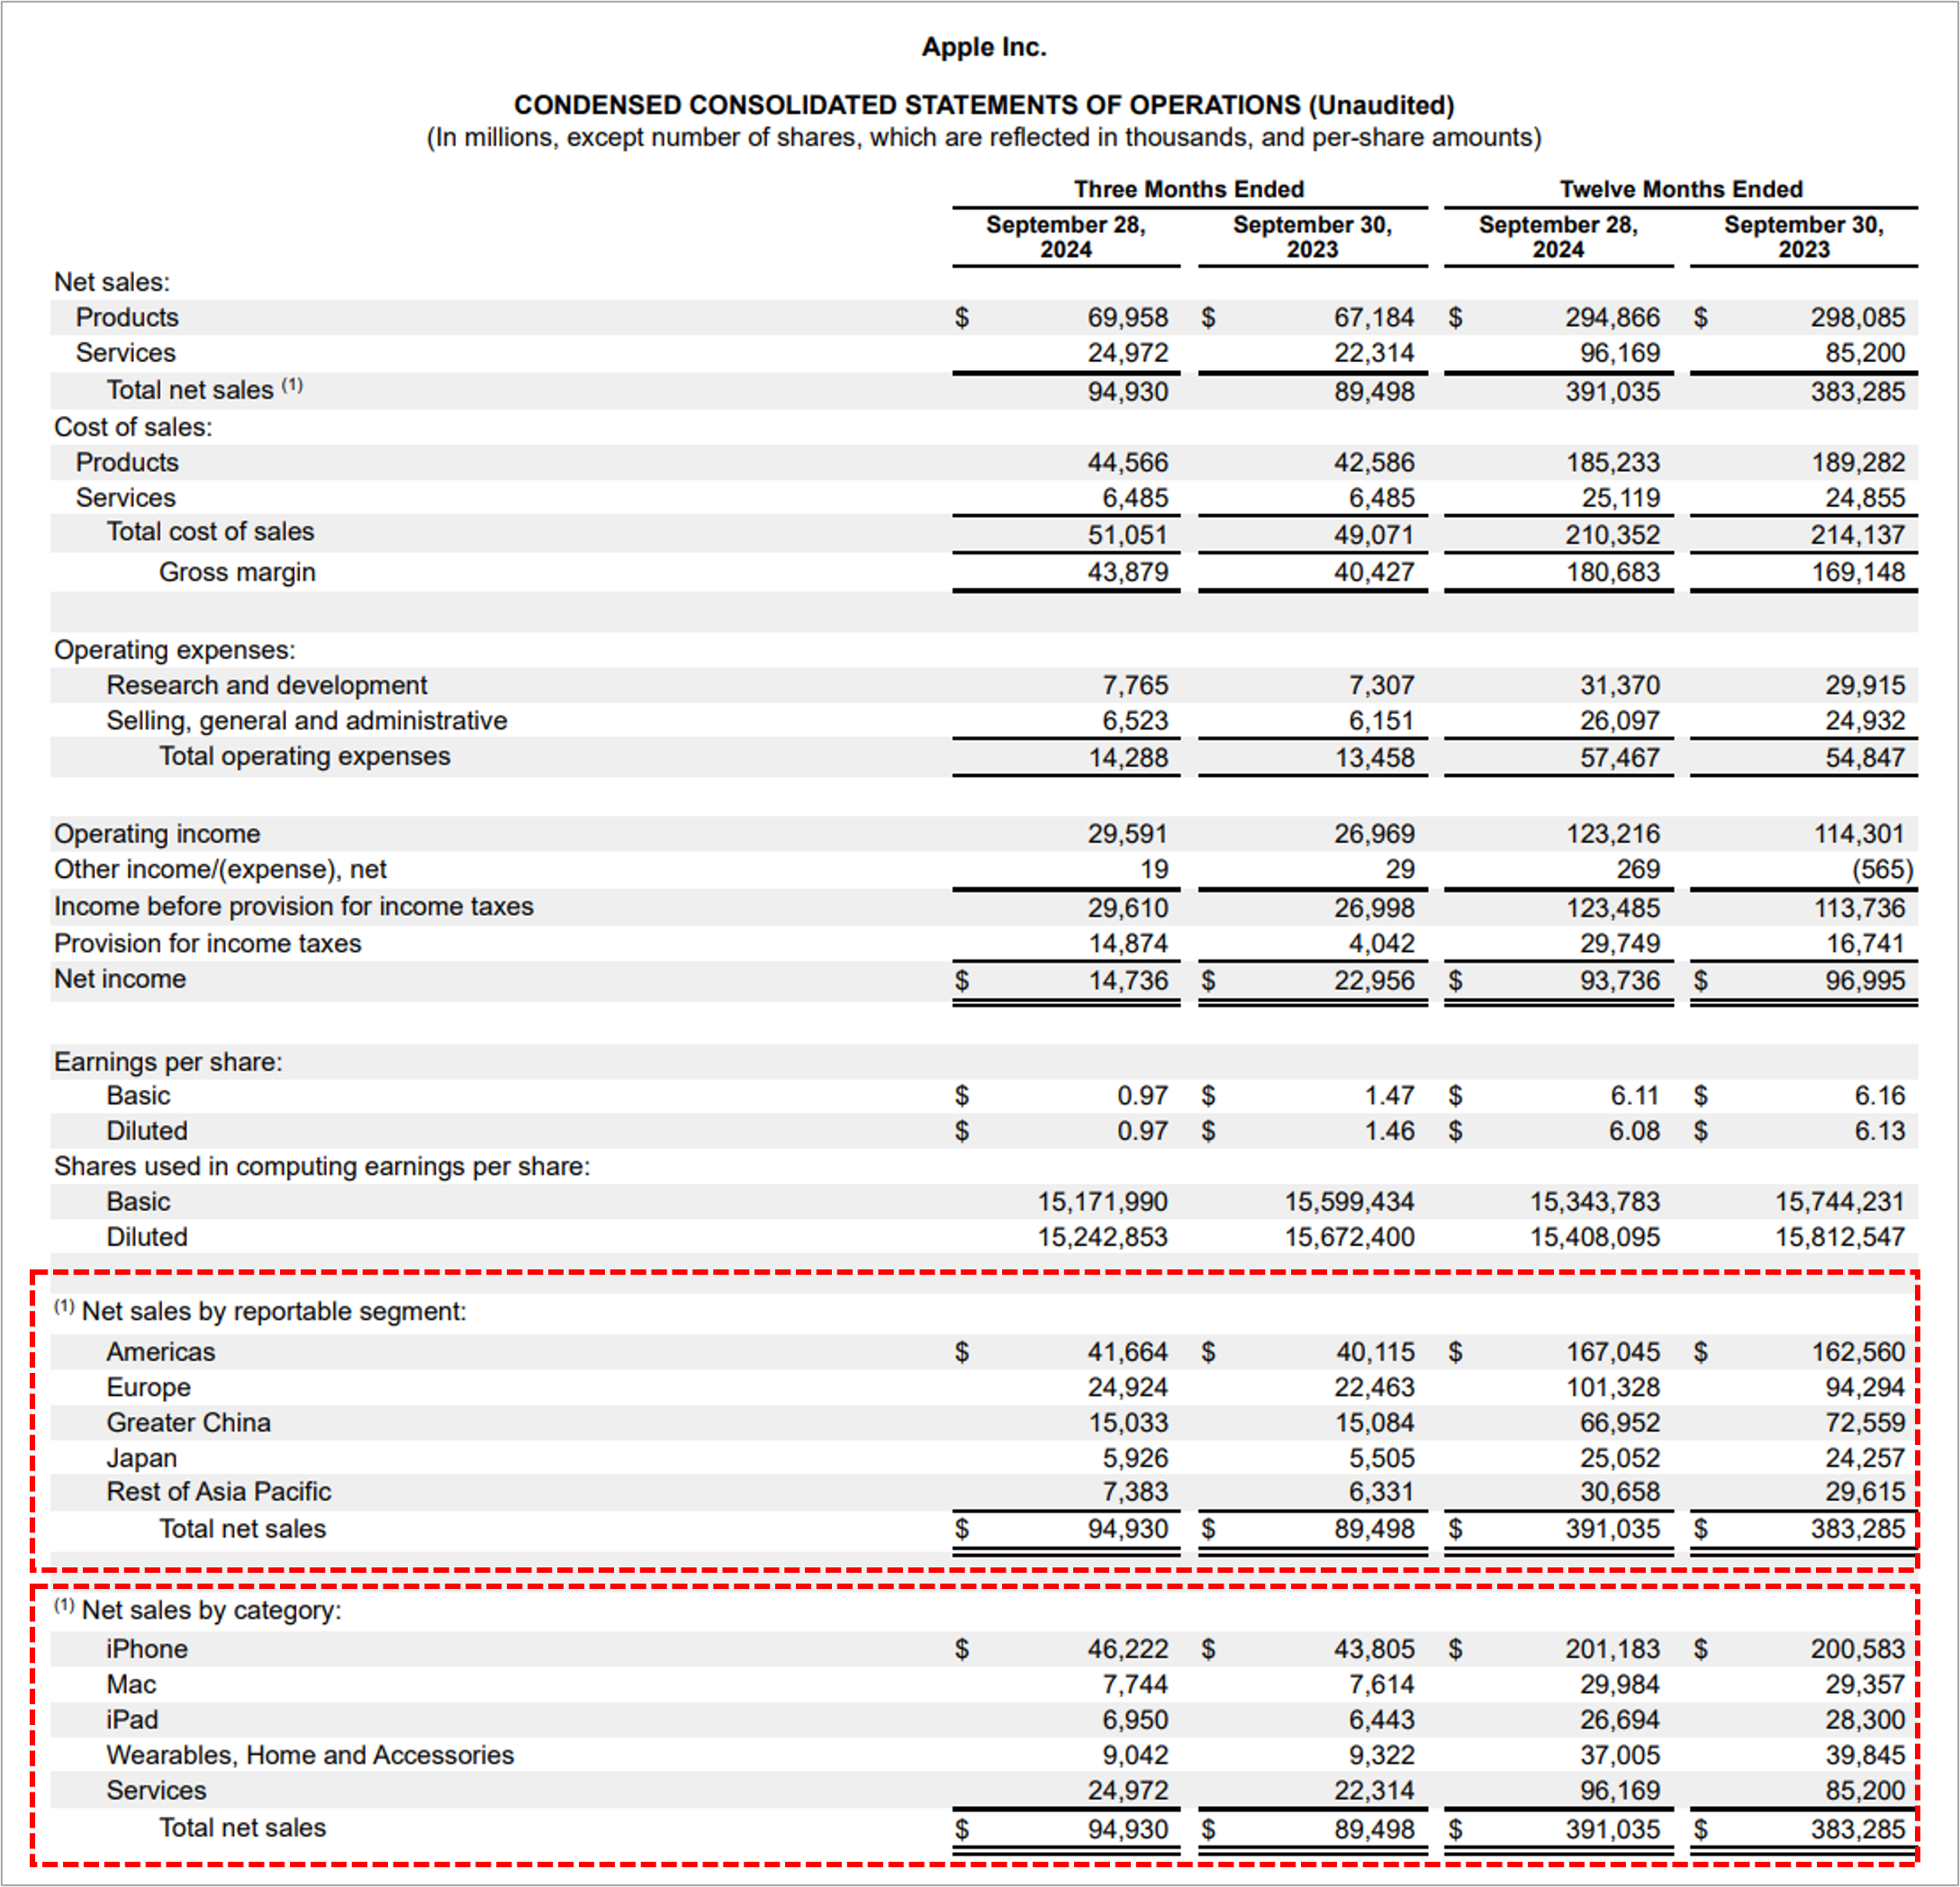
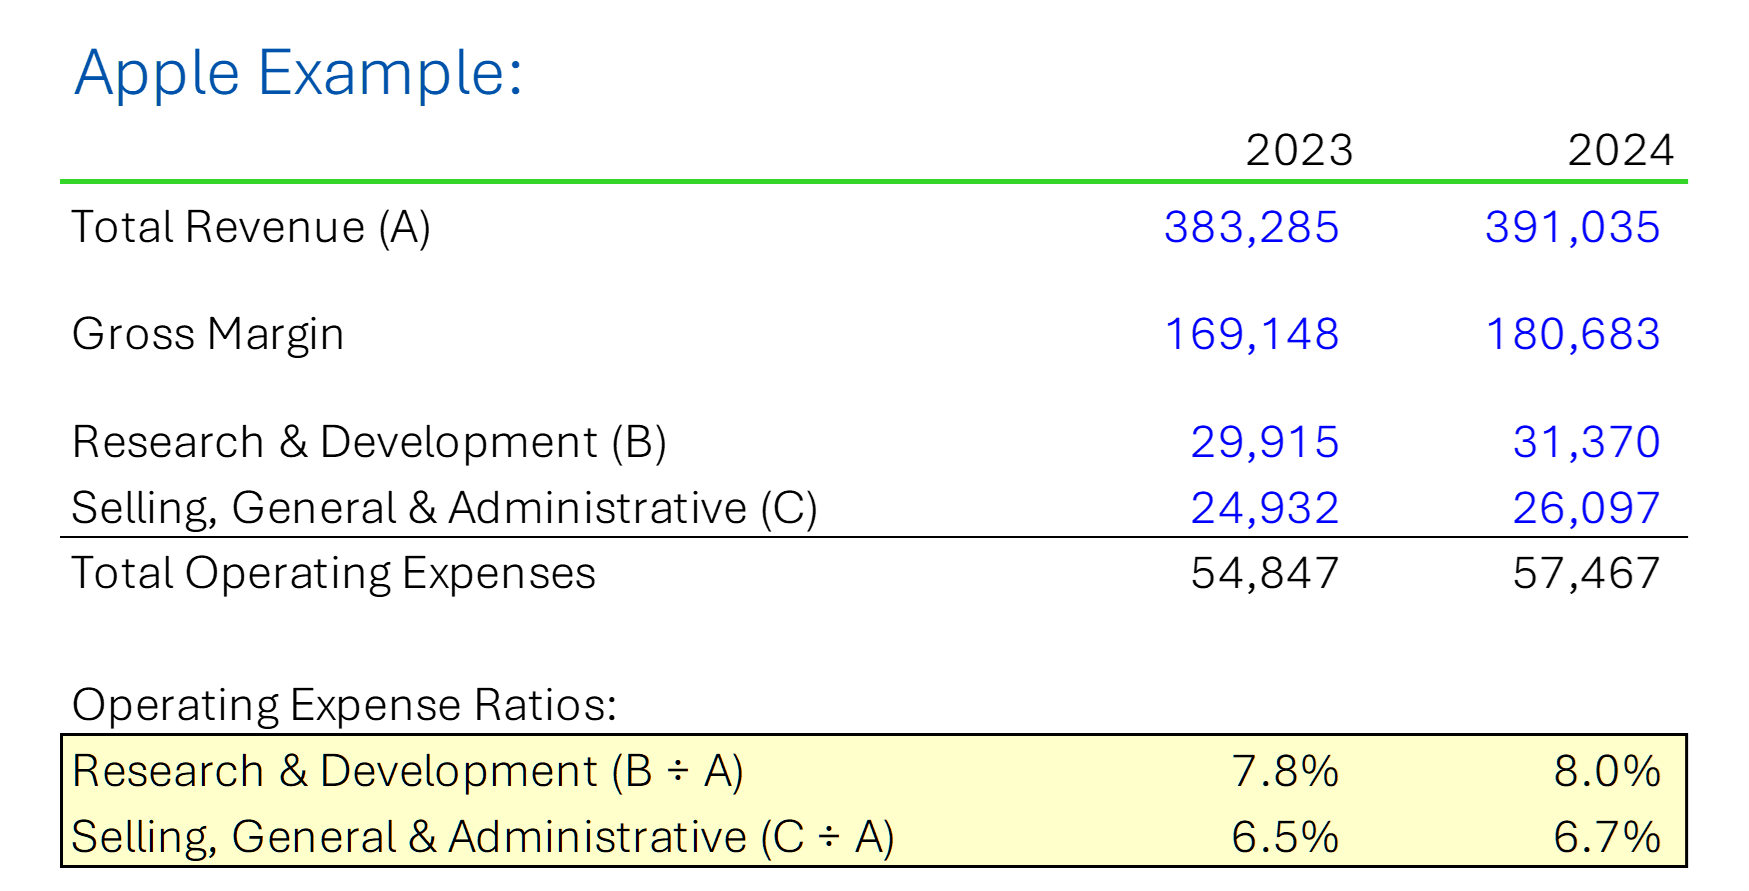
For Apple above, you would benefit from modelling Product Revenue by the various categories, like iPhone, Mac, etc.
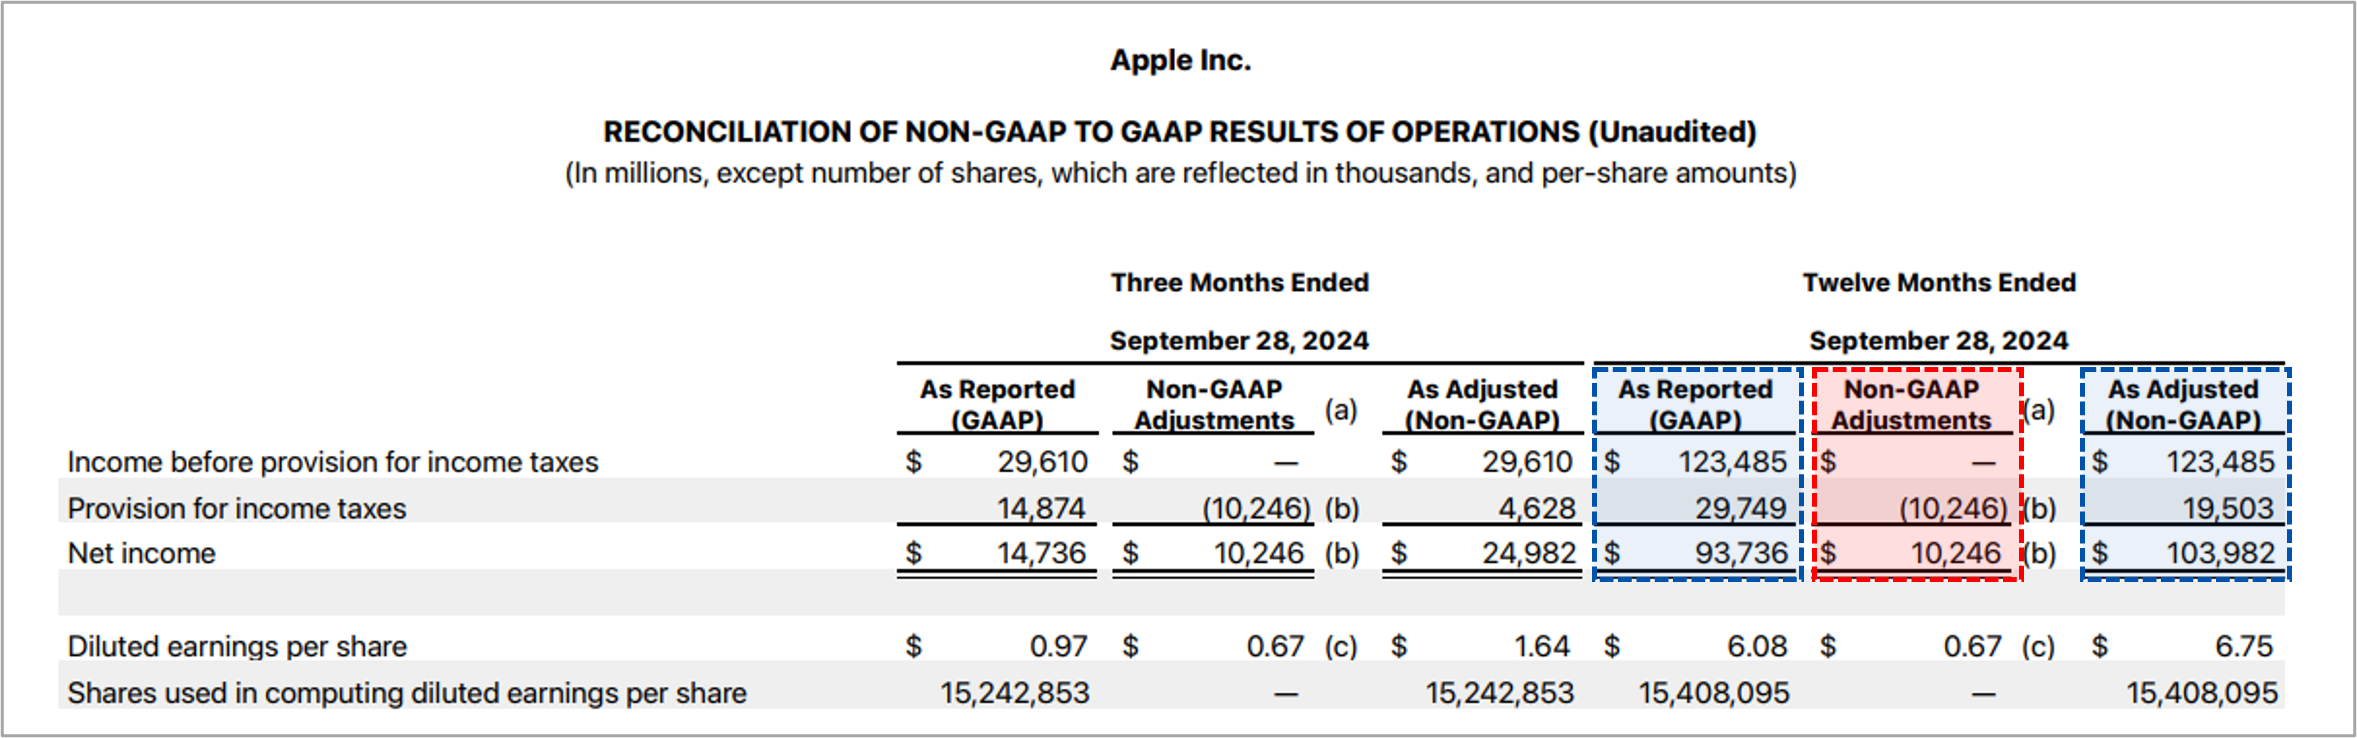
As for finding the ‘Non-GAAP’ figures, these are sometimes contained in the press release the company puts out on the day of their earnings - as in the case of Apple above.

Or sometimes this information is contained in their quarterly presentation, as with Nvidia above, or even in the 10K/1Q’s notes (heavily disclaimer’d of course).
Pt. II - Building the Model: Historical Financials
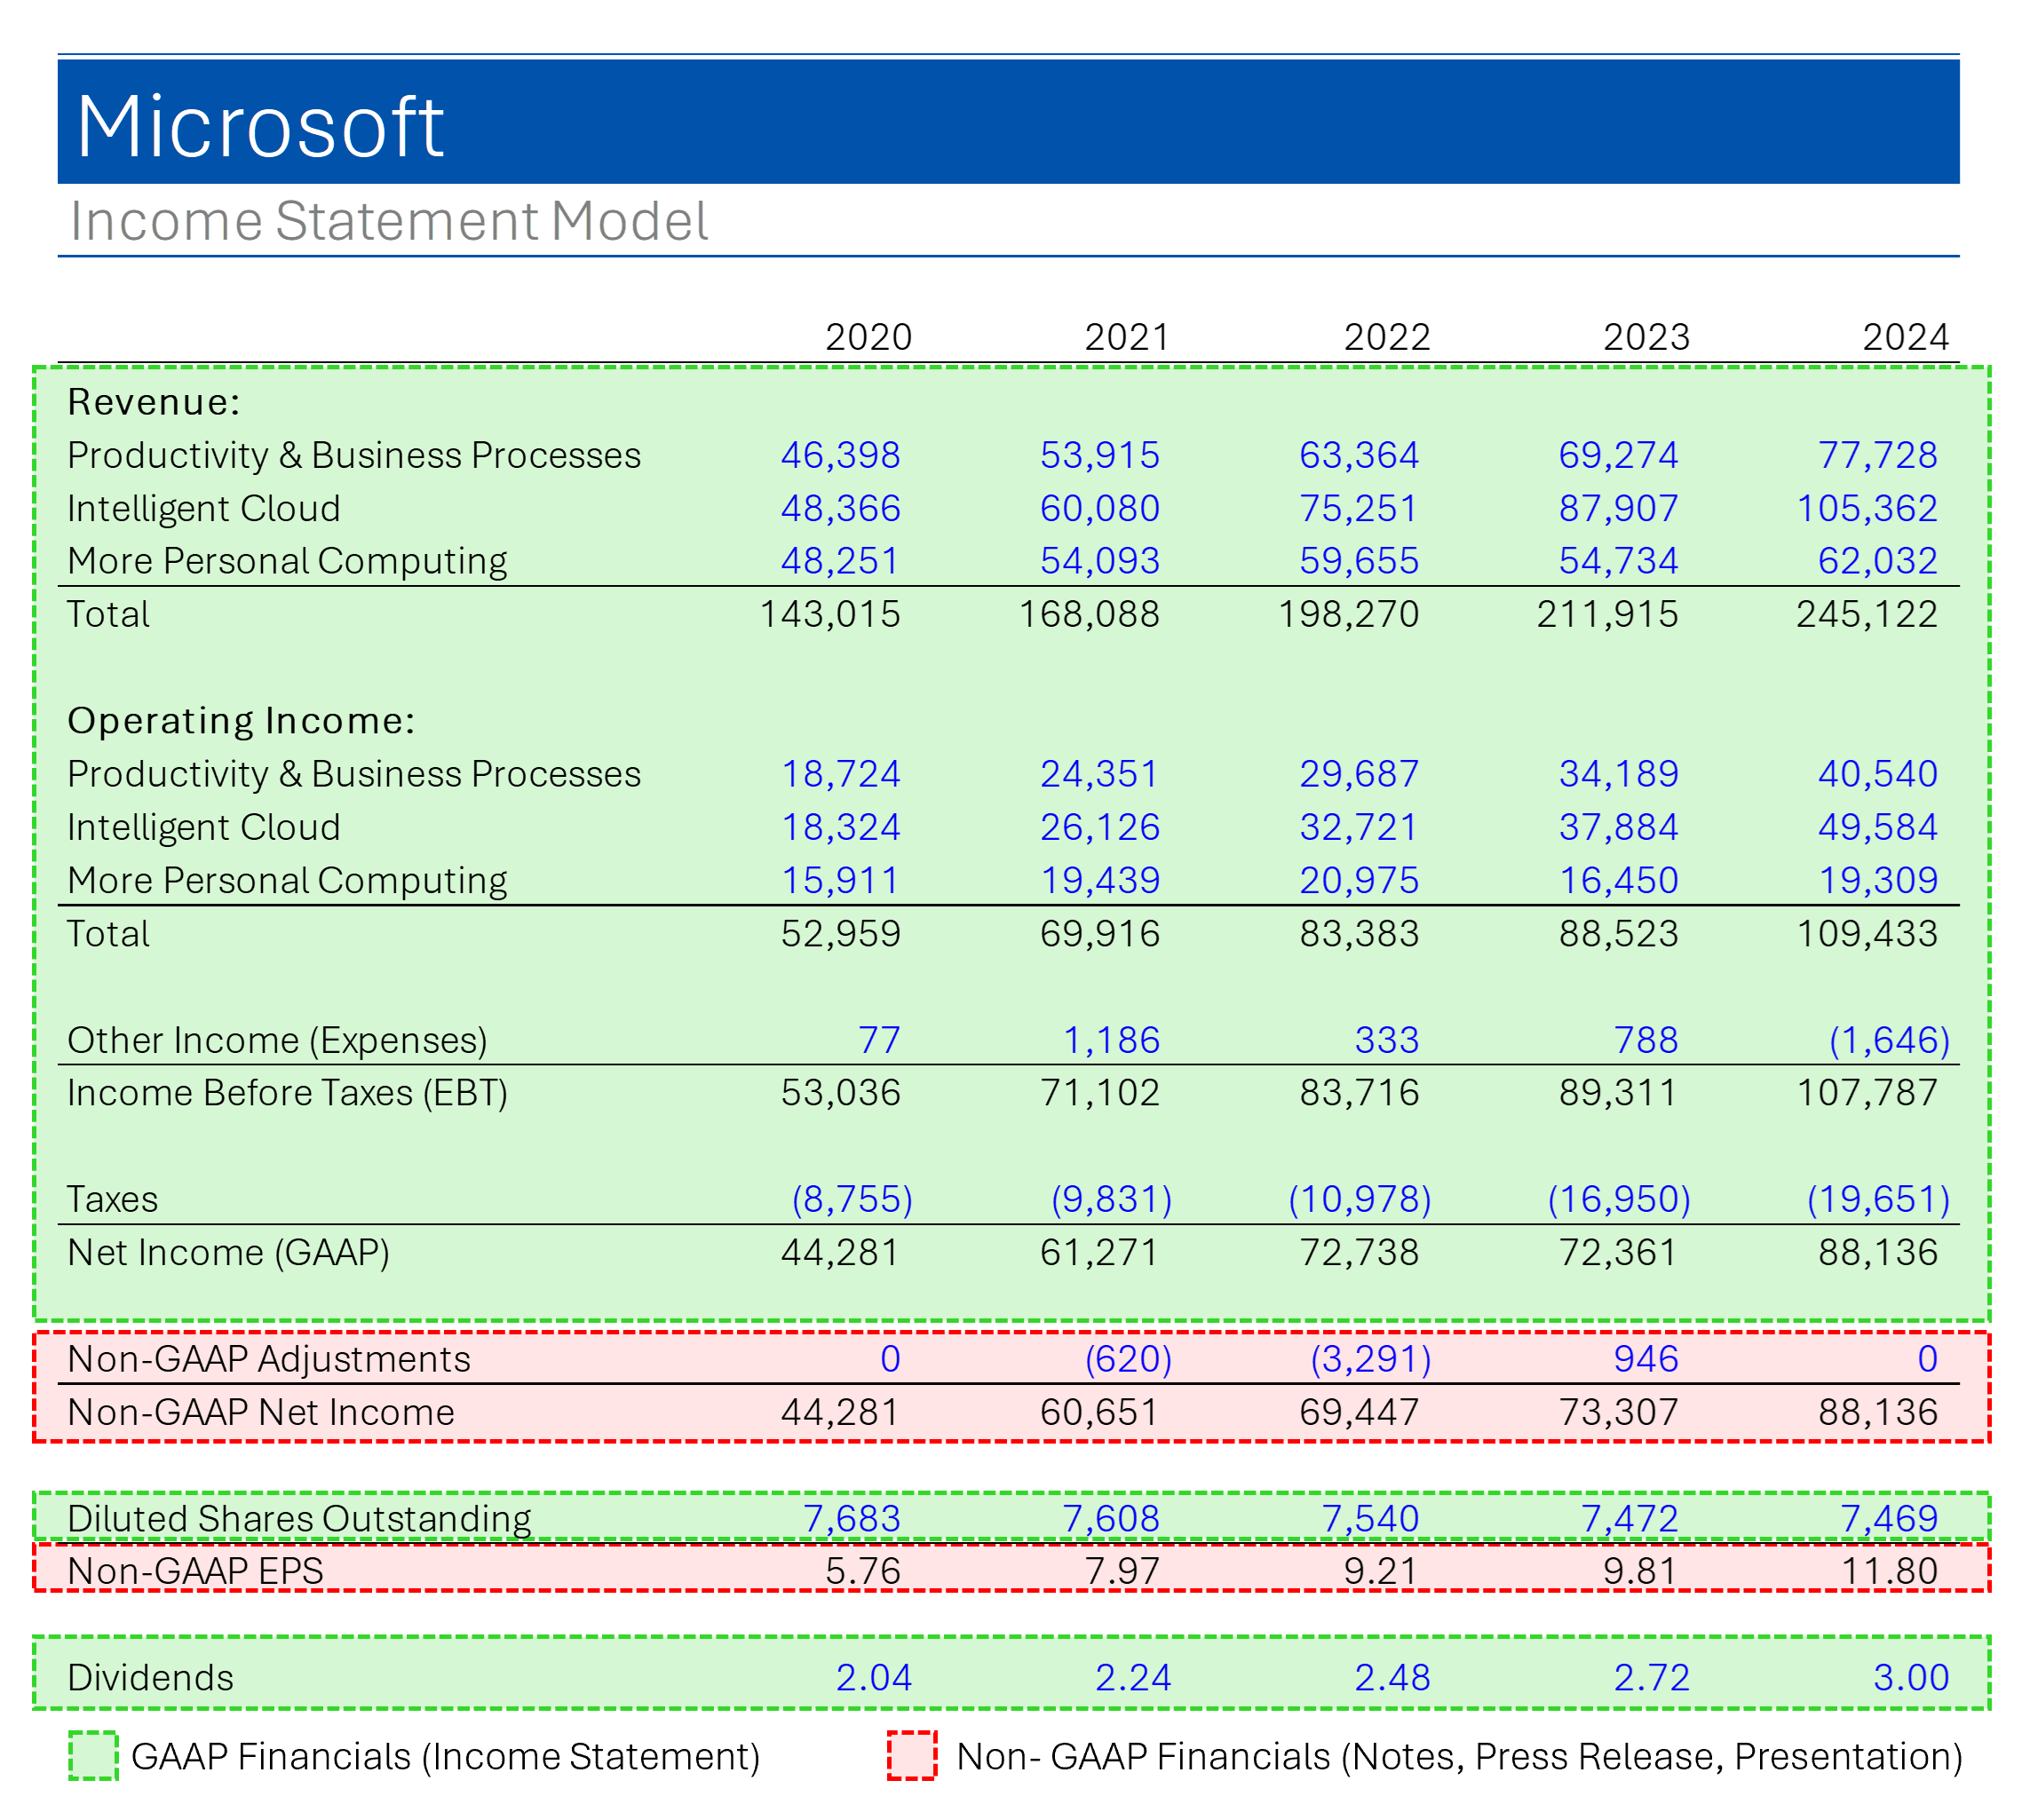
When inputting the data from the Income Statement and Press Release/Presentation, one of the core principles of financial modelling is that ‘hardcodes’ - figures you manually type into the cell - are labelled blue, while formulas (=A1+B1) are labelled in black.
It’s important to sense check things to make sure they match the financials. For example, above ‘Non-GAAP Net Income’ is a formula found by adding ‘Net Income (GAAP)’ to ‘Non-GAAP Adjustments’. Make sure that the formulas’ output matches what is shown in the Press Release/Presentation.
If it doesn’t match the ‘Non-GAAP Net Income’ figure in the Presser/Presentation then you’ve messed up somewhere.
Pt. III - Building the Model: Ratios & Growth Rates
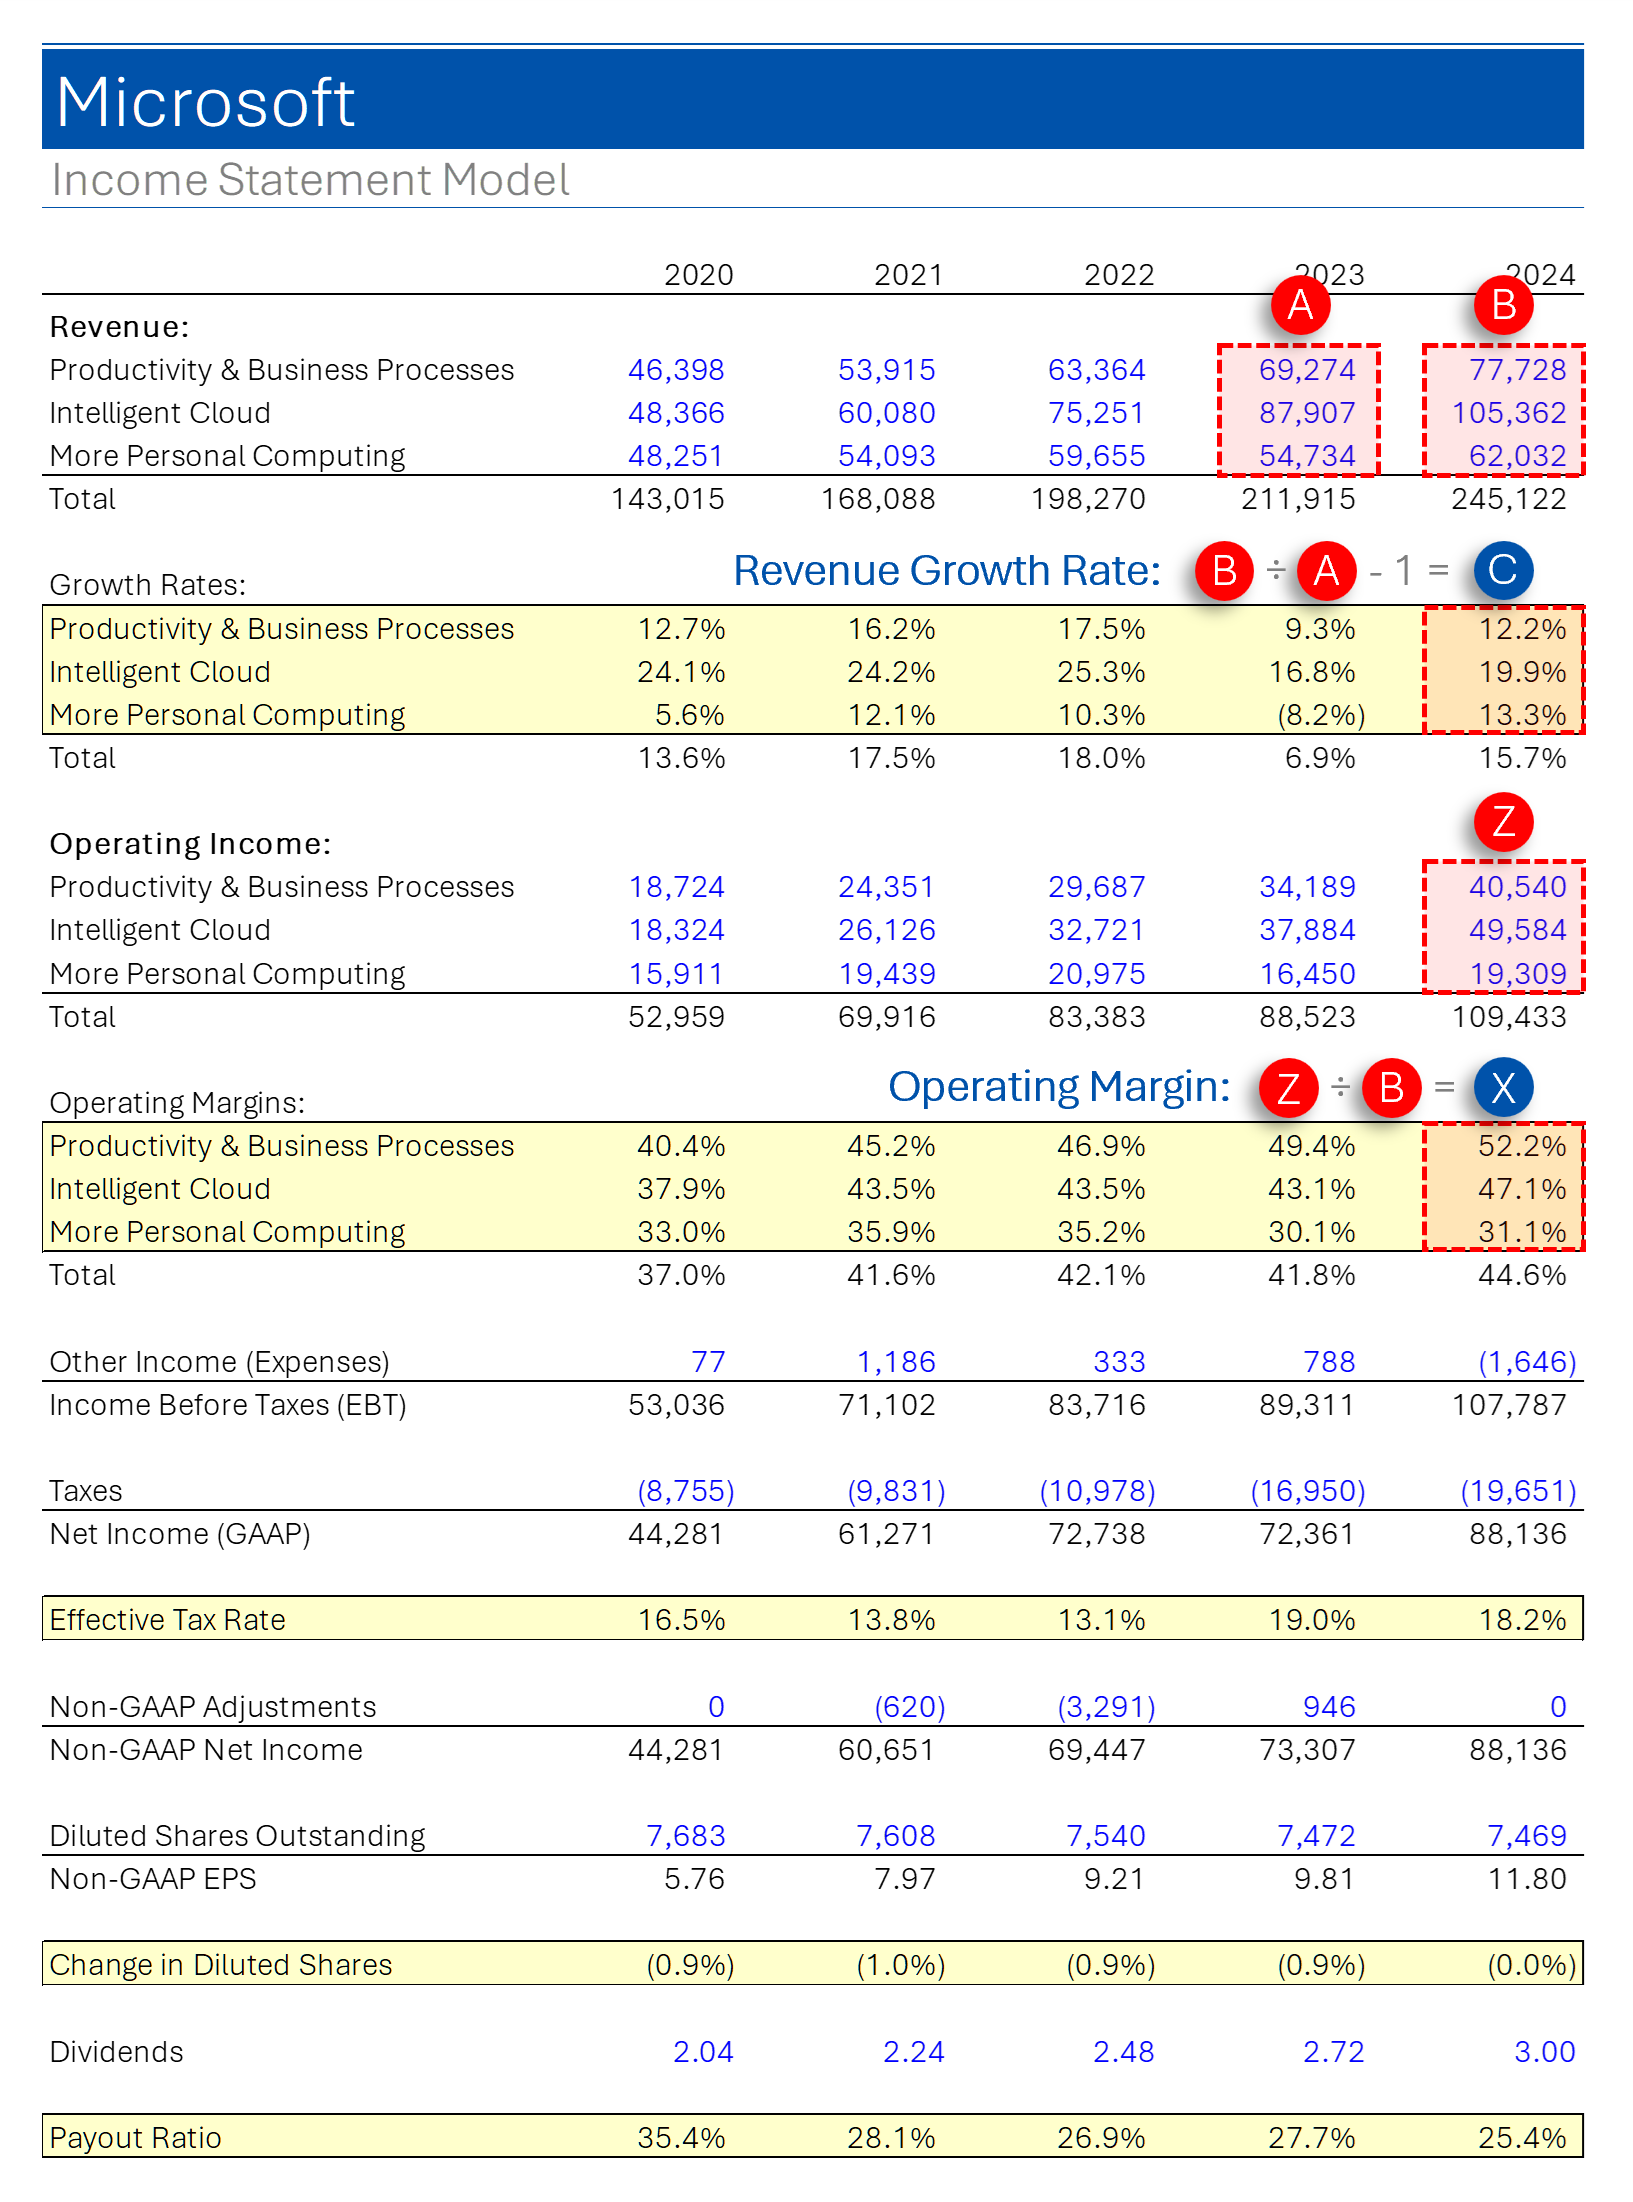
The areas highlighted in yellow are the historical ratios and growth rates we need to compute in order to determine reasonable estimates for the future. For example, Microsoft’s ‘Intelligent Cloud’ has historically grown by 25-17% per annum at an Operating Margin between 38-47% (and growing). Unless you are forecasting some sort of boon or catastrophe, those are pretty decent goal posts for the future of the business.
The calculations are pretty straightforward with the main ones illustrated above. Of the ones not shown they are simply:
Effective Tax Rate: Taxes Paid ÷ Net Income
Change in Diluted Shares: Growth rate of shares (S△ = S0 ÷ S-1 - 1)
Payout Ratio: Dividends ÷ Net Income
Note that the Microsoft model above is based on Operating Income data provided by the company. Not all companies provide this, and in which case you will generally have to replace this with other Operating Expense information.
For example, for Apple you would just use ‘Selling, General and Administrative Expense’ and ‘Research & Development’ - both of which you would use a ratio of each vs. Total Revenue.
Pt. IV - Building the Model: Forecast Period

The next step is filling in your estimates for the future growth rates and ratios that will drive you model’s forecast. This is part art, part science, and is where your research and understanding of the business comes into play (the rest of the model is just mechanics).
‘Wiring up’ the estimates is pretty straight forward and outlined above for the main items. Things not included are accomplished by the following:
Taxes: Forecast Effective Tax Rate x Net Income
Diluted Shares Outstanding: Growth rate, like Revenue (S0 = S-1 x (1+ S△))
Dividends: Forecast Payout Ratio x Net Income
Step 2: Share Price & Return Estimation

The ‘Return Analysis’ component of the model essentially uses the estimates for EPS from the Income Statement model and applies various P/E multiples to them (Base Case, Bear Case, Bull Case) to derive estimates for future share prices.
The P/E multiples selected require making reasonable assumptions about the future of the business and what the individual believes the market will be willing to pay for those shares in the future.
From there, a simple Internal Rate of Return (IRR) calculation is used to convert the future price of the shares (plus expected future dividends) into an estimate for the return to be expected from investing in the shares for both 3-Year and 5-Year holding periods.
Conclusion
To recap, this type of model isn’t meant to be the beginning and end of someone’s analysis on a company. Choosing which estimates to use and a holistic understanding of the business are fundamental in making wise investment decisions.
However, I think it is one of the most efficient ways to quickly dive into a company; see what makes it tick; and determine if there could be an opportunity requiring additional work.
Lastly, what I like about this approach is that it’s not needlessly complicated: What do you think earnings will be like in a few years, and what do you think people would be willing to pay for those earnings?
I could rant all day about Discounted Cash Flow models and the perils of calculating ‘intrinsic value’ based a slew of theoretical methodologies and abstract assumptions. At the end of the day, a stock is only worth as much as someone is willing to pay for it.

Netflix Crushes Q4
(but I’m still pissed about the subscription price increases)
Netflix shares surged 14% after reporting strong Q4 results, surpassing 300 million paid memberships and achieving record subscriber growth of 19 million. This also marks their sixth straight beat on EPS and Revs following a rather turbulent 2021-to-2023 period.
Earnings per share: $4.27 vs. $4.20 expected
Revenue: $10.25 billion vs. $10.11 billion expected
Paid memberships: 301.63 million vs. 290.9 million expected

The company attributed its growth to a robust content slate, improved product offerings, and seasonal trends, estimating its global audience, including "extra member accounts," exceeds 700 million.
Revenue increased 16% year-over-year to $10.25 billion, while net income more than doubled to $1.87 billion, driven by successful titles like Squid Game season 2 and live events… like that embarrassment of Jake Paul vs. Mike Tyson.
Annoyingly, the company announced a price hike for some streaming tiers and noted ad-supported memberships grew 30% quarter-over-quarter, with ad plans accounting for 55% of sign-ups in markets where offered.
Any way you slice it, Netflix seems to have turned things around and is in its strongest position in years. Recall back in 2021 that the stock melted down after quarterly subscribers declined, sparking concerns over ‘peak Netflix’.
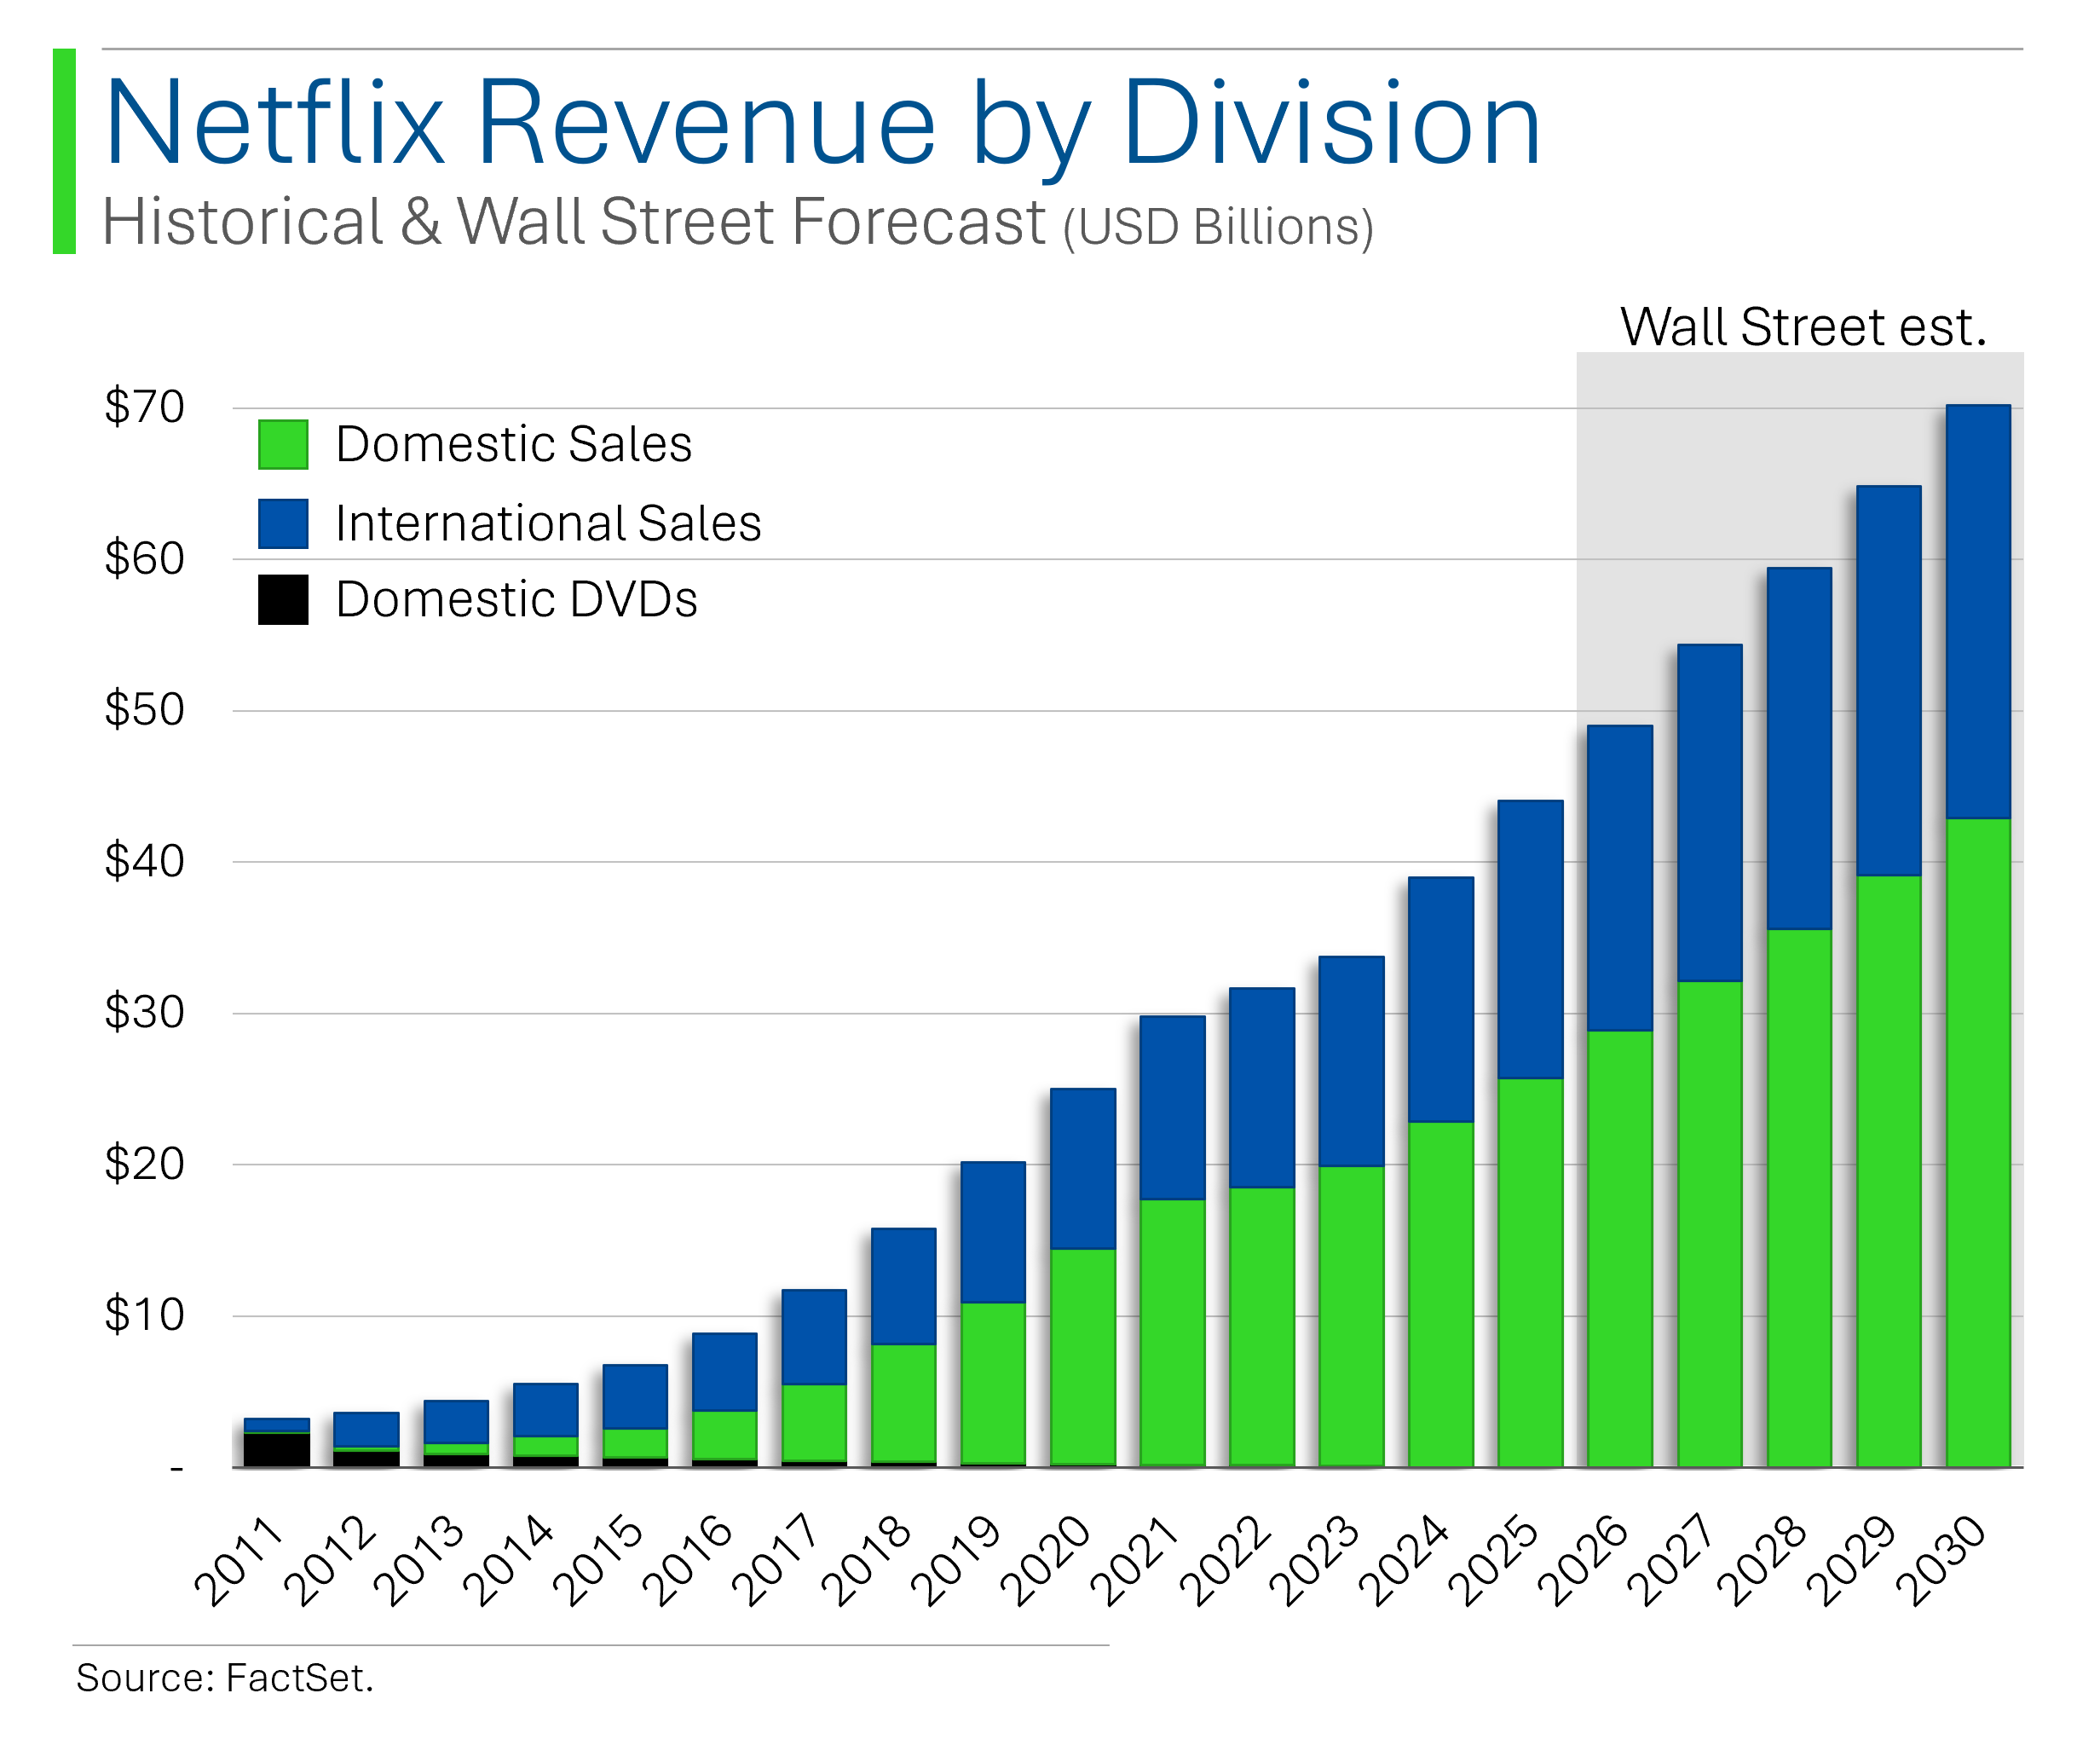
Domestic revenue has also kept up as the narrative that the only growth left would come from international markets (ie: lower subscription prices) seems to be far from reality.

Despite the rally, Wall Street still remains pretty positive on the shares. Yup, the Street has a higher percent of ‘Buys’ than they did back in 2022 - a whole +488% share return ago…


Joke Of The Day
What do Economists, Plumbers and Garbagemen have in common? Gross Domestic Product.

Macro Update
Japan Rate Hike [Friday]
The Bank of Japan increased interest rates from 0.25% to 0.50% as expected. The increase takes Japanese rates to the highest they’ve been in 17 years.

Flash Purchasing Managers’ Index [Friday]
Manufacturing PMI rose to 50.1, exceeding the consensus estimate of 49.5 and marking its first return to growth territory in six months.
Services PMI fell to 52.8, the weakest reading since April 2024 and below the 56.7 consensus. The report highlighted intensifying inflationary pressures, with both input costs and average selling prices rising at their fastest rates in four months. Despite this, employment grew in January at its fastest pace in two-and-a-half years.


Consumer Sentiment [Friday]
The final January University of Michigan Consumer Sentiment Index declined for the first time in six months, registering at 71.1 compared to a consensus of 73.1.
Year-ahead inflation expectations increased sharply from 2.8% in December to 3.3%, the highest level since May 2024, while long-run inflation expectations climbed from 3.0% to 3.2%.
The Current Economic Conditions Index dipped to 74.0 from 75.1 m/m, and the Index of Consumer Expectations fell to 69.3 from December’s 73.3.

Trivia
Today’s trivia is on investing terminology.
What is a "stop-loss order" in trading?
A) An order to sell a stock when it reaches a certain price
B) An order to halt trading during high volatility
C) An order to limit profit-taking on a stock
D) An order to buy additional shares at a lower price
Which formula is commonly used to calculate the intrinsic value of a stock?
A) Gordon Growth Model
B) Black-Scholes Model
C) Discounted Cash Flow Model
D) Arbitrage Pricing Theory
What is an example of the "risk-free rate" in a financial model?
A) The interest rate on a corporate bond
B) The inflation rate
C) The yield on a 10-year government bond
D) The return on a mutual fund
What does a high price-to-earnings (P/E) ratio typically indicate about a stock?
A) The stock is undervalued
B) Investors expect high future growth
C) The company is in financial trouble
D) The stock has low volatility
What is a "beta" in stock market analysis?
A) A measure of a stock's volatility compared to the market
B) A type of algorithm used in high-frequency trading
C) The profit margin of a company
D) The annual dividend yield
What does the term "alpha" represent in investing?
A) The amount of dividends paid out
B) The excess return on an investment relative to the market
C) The stock's correlation with bonds
D) The default risk of a company
(answers at bottom)
This Week In History
January 21, 1793 – Execution of King Louis XVI: During the French Revolution, King Louis XVI was executed by guillotine in Paris, marking a pivotal point in French history and the decline of absolute monarchy in France.
January 26, 1950 – India Becomes a Republic: The Constitution of India came into effect, transforming India into a republic and the world's largest democracy.
January 21, 1976 – Concorde's First Commercial Flight: The Concorde supersonic jet began its first commercial flights, significantly reducing transatlantic travel time and marking a milestone in aviation history.
Market Update

Market Movers
Friday:
DDD (3D Systems) [+26.6%]: Partnered with Daimler to launch a remote spare part printing solution.
NVO (Novo Nordisk) [+8.5%]: Positive trial results showed their obesity drug led to 22% weight loss over 36 weeks.
TXN (Texas Instruments) [-7.5%]: Q4 results were decent, but weak guidance and declining industrial segments spooked investors.
ISRG (Intuitive Surgical) [-4.0%]: Analysts liked the strong procedure growth but were cautious about 2025 expectations.
Thursday:
EA (Electronic Arts) [-16.7%]: Lowered Q3 and FY25 guidance due to a slowdown in Global Football bookings.
AA (Alcoa Corp.) [-3.7%]: Better Q4 results but warned about potential tariff impacts on aluminum and alumina production.
Wednesday:
NFLX (Netflix) [+9.7%]: Record subscriber growth and raised 2025 revenue outlook boosted shares.
IBKR (Interactive Brokers Group) [+8.8%]: Strong trading volumes helped beat expectations despite slightly lower interest income.
ORCL (Oracle) [+6.7%]: Announced a major AI infrastructure partnership with SoftBank and OpenAI.
VSAT (Viasat) [-8.8%]: Corporate shake-up and reaffirmed guidance weren’t enough to offset investor concerns.
F (Ford Motor) [-3.8%]: Barclays downgrade cited volume headwinds and 2025 uncertainties.
HAL (Halliburton) [-3.6%]: Weak North America results weighed on shares despite international growth.
Tuesday:
TEM (Tempus AI) [+35.5%]: Launched a personal health AI app called "olivia" and saw Pelosi buy call options.
GM (General Motors) [+5.7%]: Upgraded by Deutsche Bank on optimism about China, Cruise strategy, and buybacks.
MRNA (Moderna) [+5.4%]: Secured $590M from HHS to speed up mRNA-based flu vaccine development.
FTAI (FTAI Aviation) [-25.4%]: Shares sank on delays in its 10-K filing and a Muddy Waters short report.
WBA (Walgreens Boots Alliance) [-9.2%]: The DOJ filed a lawsuit accusing them of filling millions of illegitimate prescriptions.
AAPL (Apple) [-3.2%]: Weak China sales and multiple downgrades hit the stock.
Please consider giving this post a Like, it really helps get Substack to share my work with others.

Trivia Answers
A) A ‘stop-loss’ is an order to sell a stock when it reaches a certain price.
C) A Discounted Cash Flow Model calculates intrinsic value. To varying degrees of accuracy…
C) The yield on a 10-year government bond is considered ‘risk free’.
B) A high P/E multiples generally means investors expect high future growth.
A) Beta is a measure of a stock's volatility compared to the market.
B) Alpha is the excess return on an investment relative to the market.
Thank you for reading StreetSmarts. We’re just starting out so it would be great if you could share StreetSmarts with a friend that might be interested.
Your take on Mondelez (MDLZ) would be really appreciated. I can't make up my mind after the recent downturn. Is it a value trap or a good long-term opportunity once cocoa prices stabilize?
Great post. I want to learn financial modeling. What do you think about modeling the BS and CF statement? Do you think the income statement is the most useful? Thanks again